.png?width=2200&height=300&name=We%E2%80%99re%20moving%20to%20a%20new%20home!%20We%E2%80%99re%20working%20on%20something%20that%E2%80%99ll%20make%20finding%20help%20a%20whole%20lot%20easier%20one%20home%20for%20all%20our%20Customer%20Enablement%20resources.%20It%E2%80%99s%20called%20LaunchPad.%20There%E2%80%99s%20nothing%20to%20do%20(2).png)
Retention refers to the ability of an organization to retain its employees. A retention rate of 80% means the organization was able to retain 80% of its employees in a given period. Below are definitions and use cases for each of the retention calculations you'll see on the Opportunities > Retention Data tab.
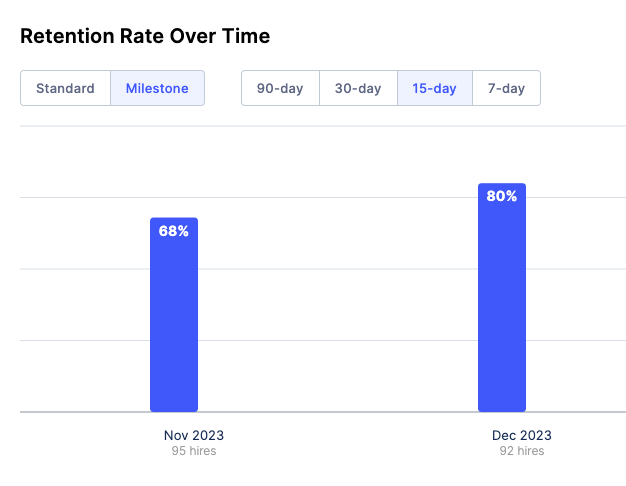
Retention Rate Over Time
- Purpose: Retention Rate Over Time is used to track the percentage of employees who remained a part of your workforce over the course of the last year. Monitoring your Retention Rate in this way can help you identify trends and opportunities to retain more of your workforce.
- Definition: Retention is measured as the number of individual employees who remained employed for the entire measurement period divided by the number of employees at the start of the measurement period. New hires are not part of this measure. For new hire retention, click the 'Milestone' button.
- FAQ:
- Q: Are new hires included in Retention calculations? A: No, this calculation only includes employees who were employed at the beginning of the measurement period. For the Retention Rate Over Time graph, the time period is the last 12 months. To view New Hire Retention, select the Milestone toggle at the top of the chart:
- Q: Can we only look at this graph for the last year? A: The default time range is the last 365 days, but can be adjusted to the last 90 days, 180 days, or a custom date range.
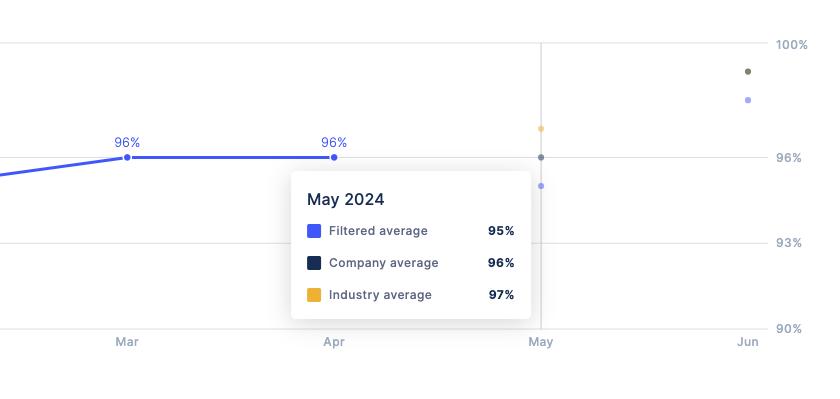
- Q: Why are the dots on this graph not connected for recent months? A: Depending on how far into the month we currently are, you may not see dots connected on the graph while WorkStep processes the data from the prior month. WorkStep has a 30-day buffer between when data collection for a month is completed and when it is officially recorded in the platform to allow for any last-minute adjustments to employees' termination dates to be submitted. Once data is officially recorded in the platform, it will be connected by a line on the graph to the prior month's percentage. By hovering over the dots for the prior month's data points, you'll be able to see where our current calculations have settled - this could change by the end of the 30-day period, though the closer you are to the end of that period means there is less of a chance of fluctuation.
Turnover Rate
- Purpose: Turnover Rate helps companies monitor the percentage of employees who have left the organization compared to total employee headcount.
- Definition: Turnover is measured as the number of terminations divided by the daily average headcount for the measurement period.
- FAQ:
- Q: Does 'terminations' refer to both voluntary and involuntary terminations? A: Yes. WorkStep refers to any employment separations as terminations, including but not limited to retirement, RIFs, and resignations. The inclusion of both cohorts can be reconfigured if your organization only measures turnover based on voluntary terminations, as an example, by reaching out to your Account Rep.
- Q: Why does this calculation include the average number of active employees? A: By measuring your average active headcount on a daily basis for the given measurement period, we are incorporating the most up to date changes in your workforce numbers. The average daily headcount = the sum of active employees each day divided by the number of days.
- As an example, if we're measuring our daily average headcount for the month of January and:
- on January 1st, and up to January 14th, we had 14 employees (for 14 days of the month, we had 14 employees)
- on January 15th we onboarded 4 more employees, and no more for the rest of the month (for 16 days of the month, we had 19 employees)
- on January 31st, 2 employees resigned (for 1 day of the month, we had 17 employees)
our daily average headcount is calculated by: { (14 * 14)+(19 * 16)+(17 * 1) } / 31, which comes to ~16.7
- As an example, if we're measuring our daily average headcount for the month of January and:
- Q: How does WorkStep know my organization’s daily average headcount? A: We reference the data included in the data upload provided at the company level and shared directly from your HRIS. If the calculation appears to yield different results than you’re used to seeing through internal turnover calculations, it could be the case that your organization is using a different calculation than WorkStep. If you have additional questions about our Turnover calculation, please reach out to your Account Rep.
YTD Turnover Rate
- Purpose: YTD Turnover helps companies monitor how their turnover rate is trending towards annual turnover goals.
- Definition: The Year to Date Turnover Rate calculates the number of terminations in your organization divided by the average number of active employees between today's date and January 1 of the current year.
- FAQ:
- Q: Can this be adjusted to reflect our fiscal year instead of January 1? A: Yes! Reach out to your Account Rep to configure this change.
Leading Indicators of Retention Rate
- Purpose: This chart presents items that contribute to your ability to retain your workforce. These items can highlight areas not covered in survey questions that are driving your retention rate.
- Definition:
- Favorability in this instance refers to the General Satisfaction theme, which calculates how satisfied employees are overall.
- New Workforce Tenure will show you the average tenure for employees who started within the last 90 days, including terminations.
- Response Rate is the number of employees who responded to a survey in the past 90 days out of those who received a survey.
- FAQ:
- Q: How does Response Rate relate to my Retention rate? A: A low Response Rate among employees is often correlated to lower retention rates, as disengaged employees are more likely to turnover.