.png?width=2200&height=300&name=We%E2%80%99re%20moving%20to%20a%20new%20home!%20We%E2%80%99re%20working%20on%20something%20that%E2%80%99ll%20make%20finding%20help%20a%20whole%20lot%20easier%20one%20home%20for%20all%20our%20Customer%20Enablement%20resources.%20It%E2%80%99s%20called%20LaunchPad.%20There%E2%80%99s%20nothing%20to%20do%20(2).png)
Our Reports feature is designed to help you synthesize and view WorkStep data all in one place. With Reports, users can view and edit existing reports, create new reports, and export any report. Exports are optimized for PowerPoint but can be opened by any presentation tool including Keynote and Google Slides. Our Reports feature offers two types of reports: Standard and Custom reports.
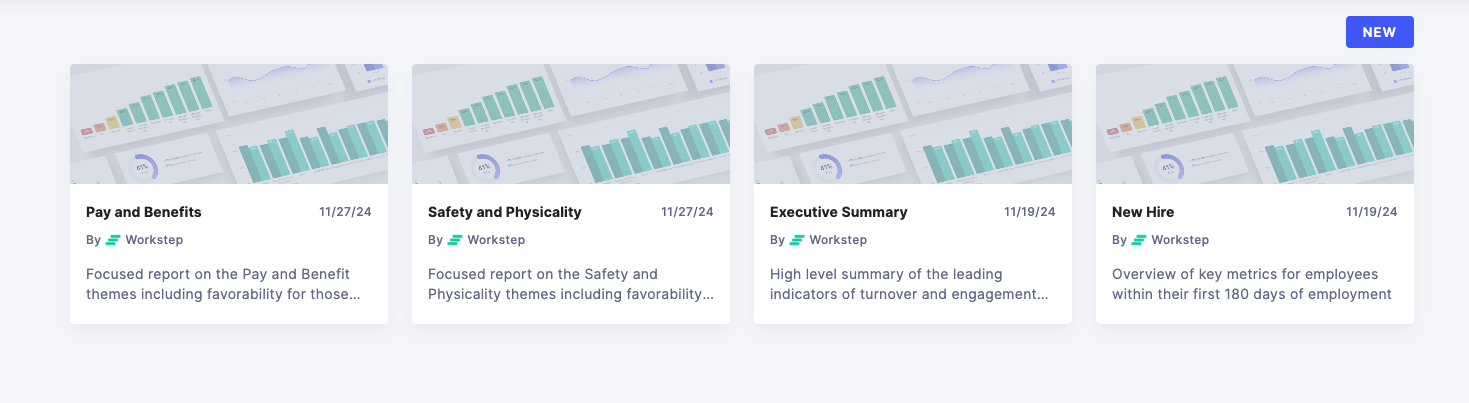
Standard Reports
Standard reports are WorkStep generated reports covering the most common areas of interest. These include reports titled: Executive Summary, New Hire, Pay and Benefits, and Safety and Physicality. While you won't be able to directly edit these reports, you can make a copy of any standard report (through the duplicate feature), and make any customizations you like.
How to duplicate a standard report
- Open the Report
- Select the Duplicate icon from the upper right-hand menu
- Select Duplicate
- Begin to edit the report (eg: change title, edit filters, add or remove graphs)
The new report will automatically save in the reports menu. If the report is not renamed, the new report will be distinguishable from a WorkStep generated Standard report because Standard reports say “By WorkStep” in the preview
Custom Reports
Custom reports are reports generated by users to include any set of data available. Creating a custom report allows users build a report from scratch and include any combination of data points, graphs, or metrics that are available in-platform.
Custom Reports are only visible to the user who created them, but users have the ability to download the report to share with others. To get started on creating your own report, follow the below steps:
- Navigate to the Reports page from the left-hand side menu on the platform and select “New.”
- Name your report, add a description, and begin building!
3. Each section of your report is referred to as a "card". Each card represents a single slide when exported and can be built to include data like Response Rates, Turnover Rates, or eNPS. They can also include graphs or charts like the Favorability Matrix, Turnover by Tenure, or Favorability Over Time, or open text.
-
- Components refer to particular data or areas of the platform you'd like to be presented on a card
- Once you choose your component type, you'll have the option to further specify what you're looking to report on - for example, if you choose Favorability for your component, you'll then be able to choose how you'd like it organized: by time, by theme, overall, etc.
- Components that can be included in your custom reports include:
4. Filters can be applied at the card level, or the the report overall so that each card, by default, is generating data for the attributes specified through filters. You can choose to filter data on individual cards by selecting attributes from the Filter option during card setup. Or, you can apply the same attribute set to all data in the report by selecting attributes from the filters at the top of the Reports page.
5. As you build your report, card names will appear on the left-hand menu while the cards stack within the report. The order of the cards in the report are customizable by dragging and dropping the name of the card from that left-hand menu.
You will be limited to 50 cards per report, but can export any report you'd like to powerpoint to combine or consolidate any number of cards.
6. Once you've finished making edits, you can preview the report with the eye icon at the top right menu.
7. Use the Download option at the top right of the page to export your report to Powerpoint
For more information on exporting your report, see our article on Exporting and Sharing Data.
Report Builder Modes
Preview Mode
This is the default view when a report is opened. While the Report is in Preview mode:
- A Title & Description Card appears at the top of the Item Stack
- Cards can only be viewed, and their Components interacted with, but not manipulated
Editing Mode
Access this mode by building a new report, duplicating a Standard report, or by selecting the pencil icon to edit any existing custom report. While the Report is in Edit mode:
- A Title & Description Card appear at the top of the Item Stack
- The Title & Description Card cannot be deleted, duplicated, or moved - only edited
- Other Cards can be added, edited, duplicated, deleted, or previewed individually by selecting the icons in the bottom right of the card
- Preview a Card independently by selecting the Checkmark Icon; edit the card again by selecting the Pencil icon.
- Users with access to 20 or more facilities will need to create multiple Hiring and Turnover Breakdown cards, as each card can display a maximum of 20 rows of data.