Insights
WorkStep RETAIN Insights give you actionable insights at your fingertips for areas of Favorability, Responsiveness, Reachability, and Retention.
- Favorability: Favorability is the percentage of responses that were ‘favorable’ for a question. 4 (‘Agree’) and 5 (‘Strongly Agree’) are considered ‘favorable’ responses on a 5-point question scale.
- Responsiveness: Responsiveness represents the response rate for the WorkStep check-ins or the total number of respondents divided by the total number of recipients.
- Reachability: Reachability represents what percentage of your workforce is reachable for check-ins based on available contact information, opt-outs, and bounce backs.
- Retention: Retention is the ability of an organization to retain its employees. A retention rate of 80% means the organization retained 80% of its employees in a given period.
Favorability
- Favorability by Theme: The percentage of favorable responses within a given theme. Themes are created by grouping related questions under a common theme. This allows you to compare favorability by theme.
- What does Favorability mean? Favorability is the percentage of employees who answered favorably on a question. Favorable responders responded to the question with a 4-5 score. Favorability is an easier way to communicate the percentage of employees who feel positively about a topic or theme. We use Favorability here because it is easier to interpret and compare than an average score.
To view the Favorability by Theme Matrix Chart, click on the table icon. A matrix chart is a grid view that segments favorability by a secondary value.
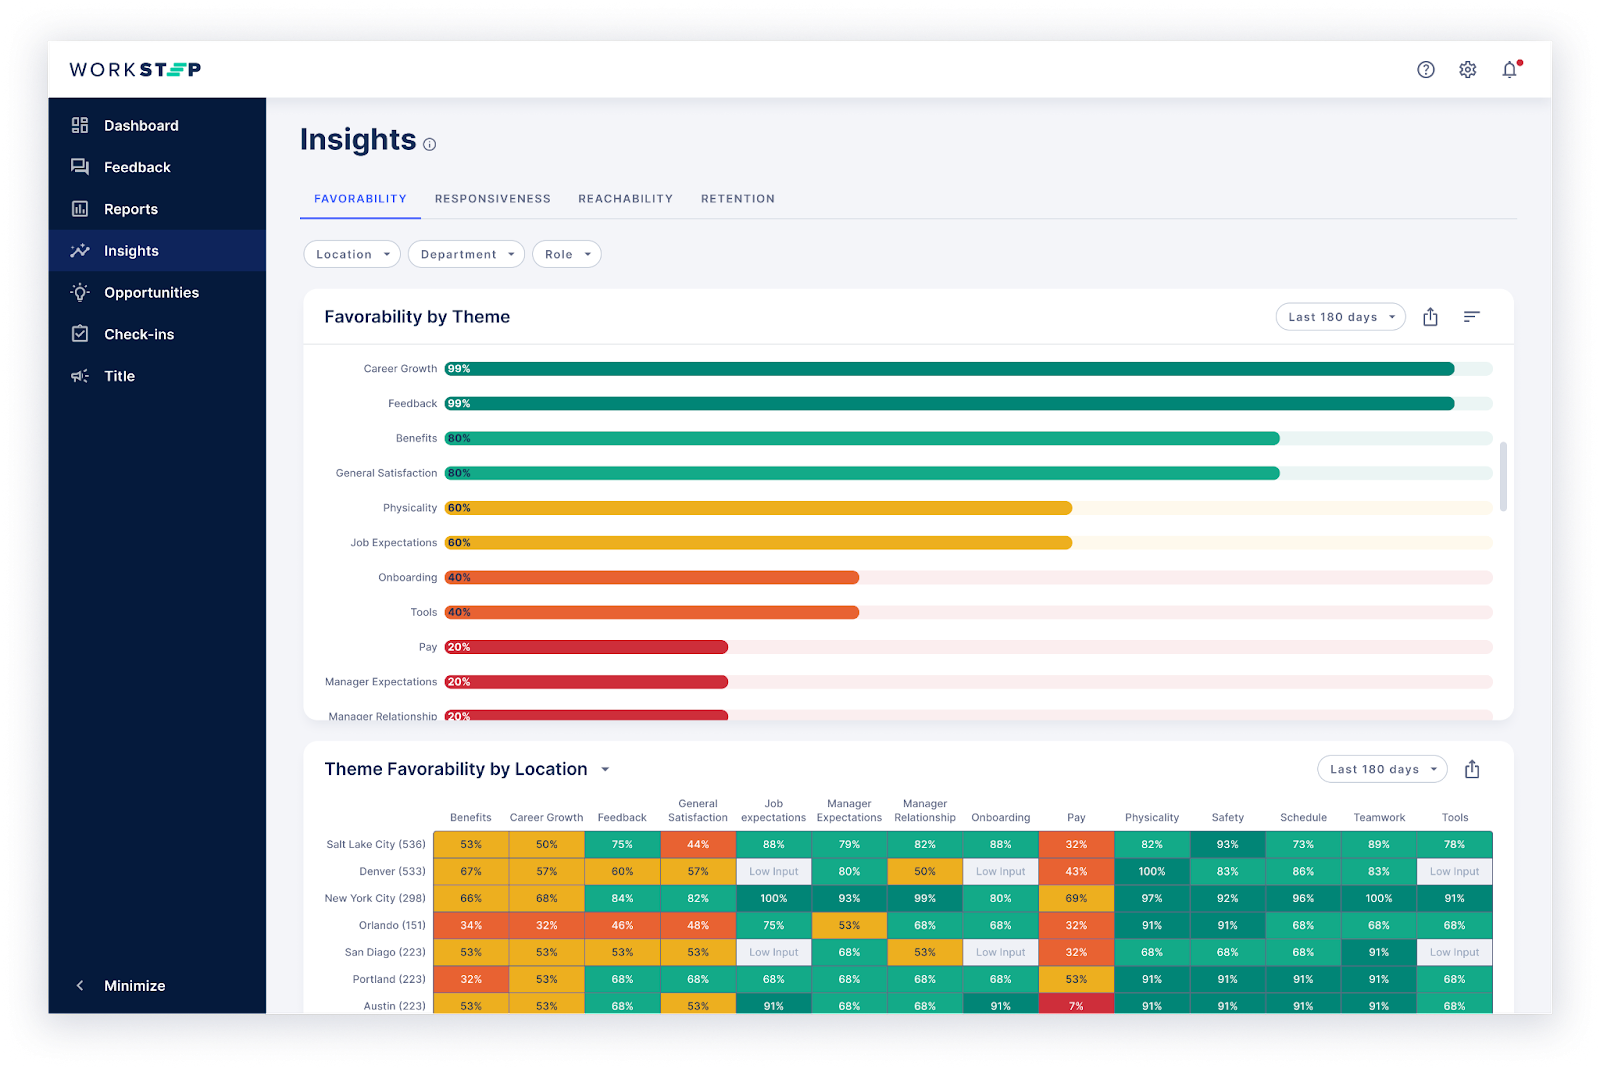
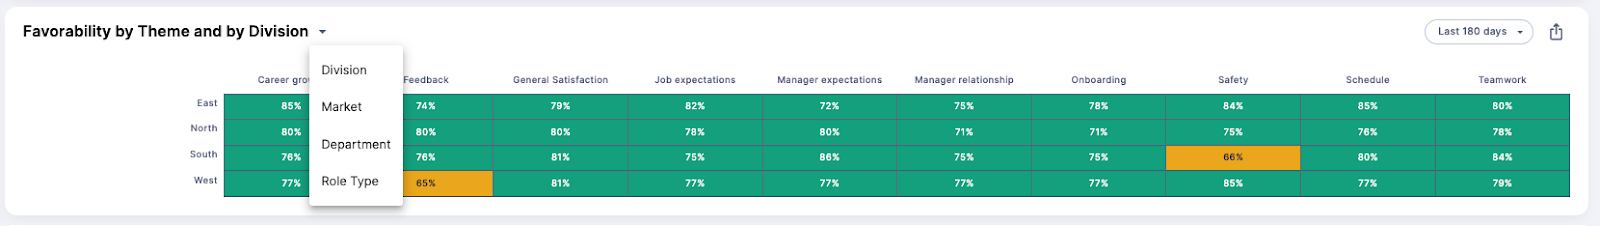
Favorability by Theme and by Segment Heatmap: The percentage of favorable responses within a given theme by selected Attribute (Role, location, etc.). This allows you to compare favorability across themes and a secondary value.
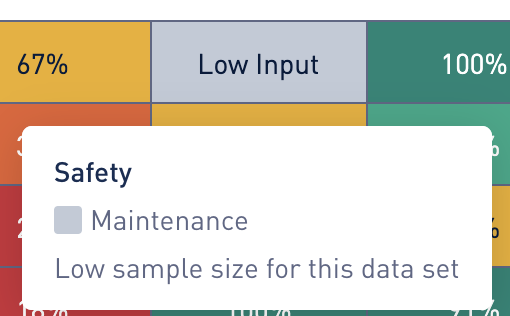
Low Input
You may see a cell in the matrix chart that says "Low Input" which occurs when the data set includes feedback from fewer than 3 respondents for a particular theme.
Color Coding for the Favorability Bar Chart and Matrix Chart
Colors are used to identify bands of favorability.
Color | Percent Favorability |
Red | 0-30% favorability |
Orange | 30 - 50% favorability |
Yellow | 50 - 70% favorability |
Light Green | 70 - 90% favorability |
Dark Green | 90 - 100% favorability |
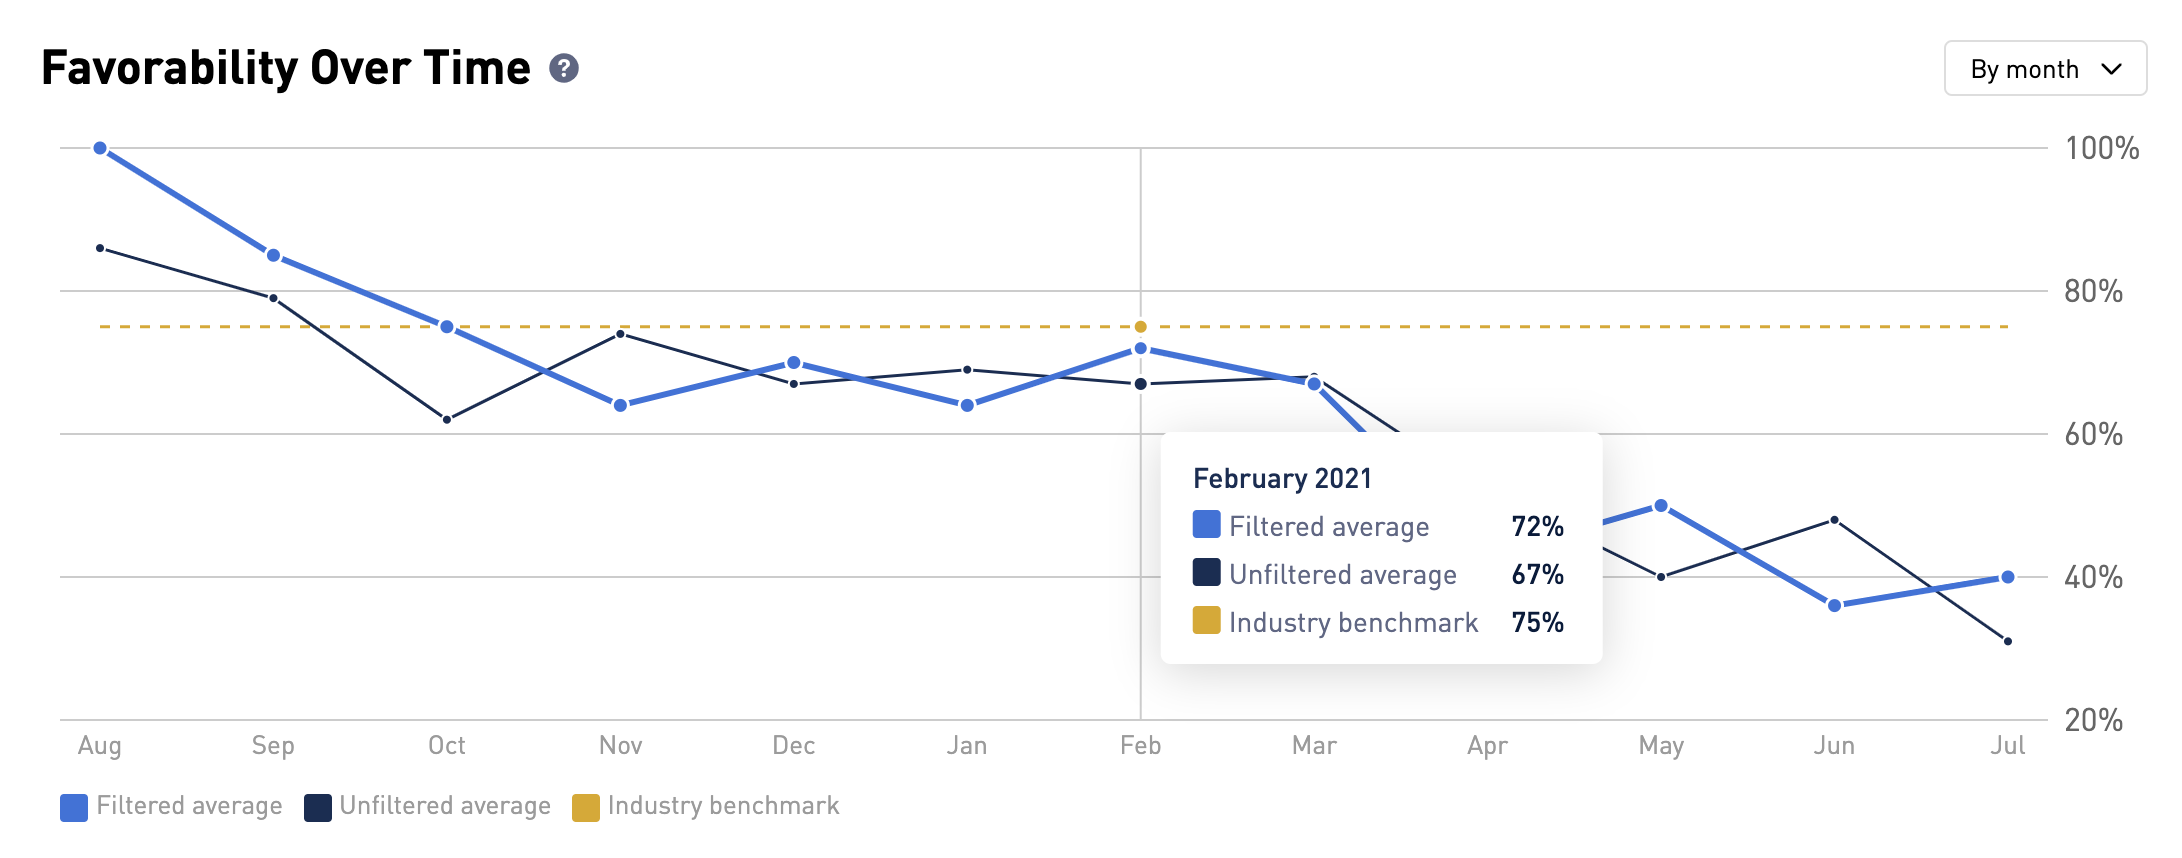
Favorability Over Time: Filtered by the general satisfaction theme, it looks at all the answers for all check-in questions with a 1-5 scale. It calculates the percentage of favorable responses (4-5 answer) versus unfavorable answers, compared to the industry benchmark, shown over time. This allows you to track aggregate favorability over time.
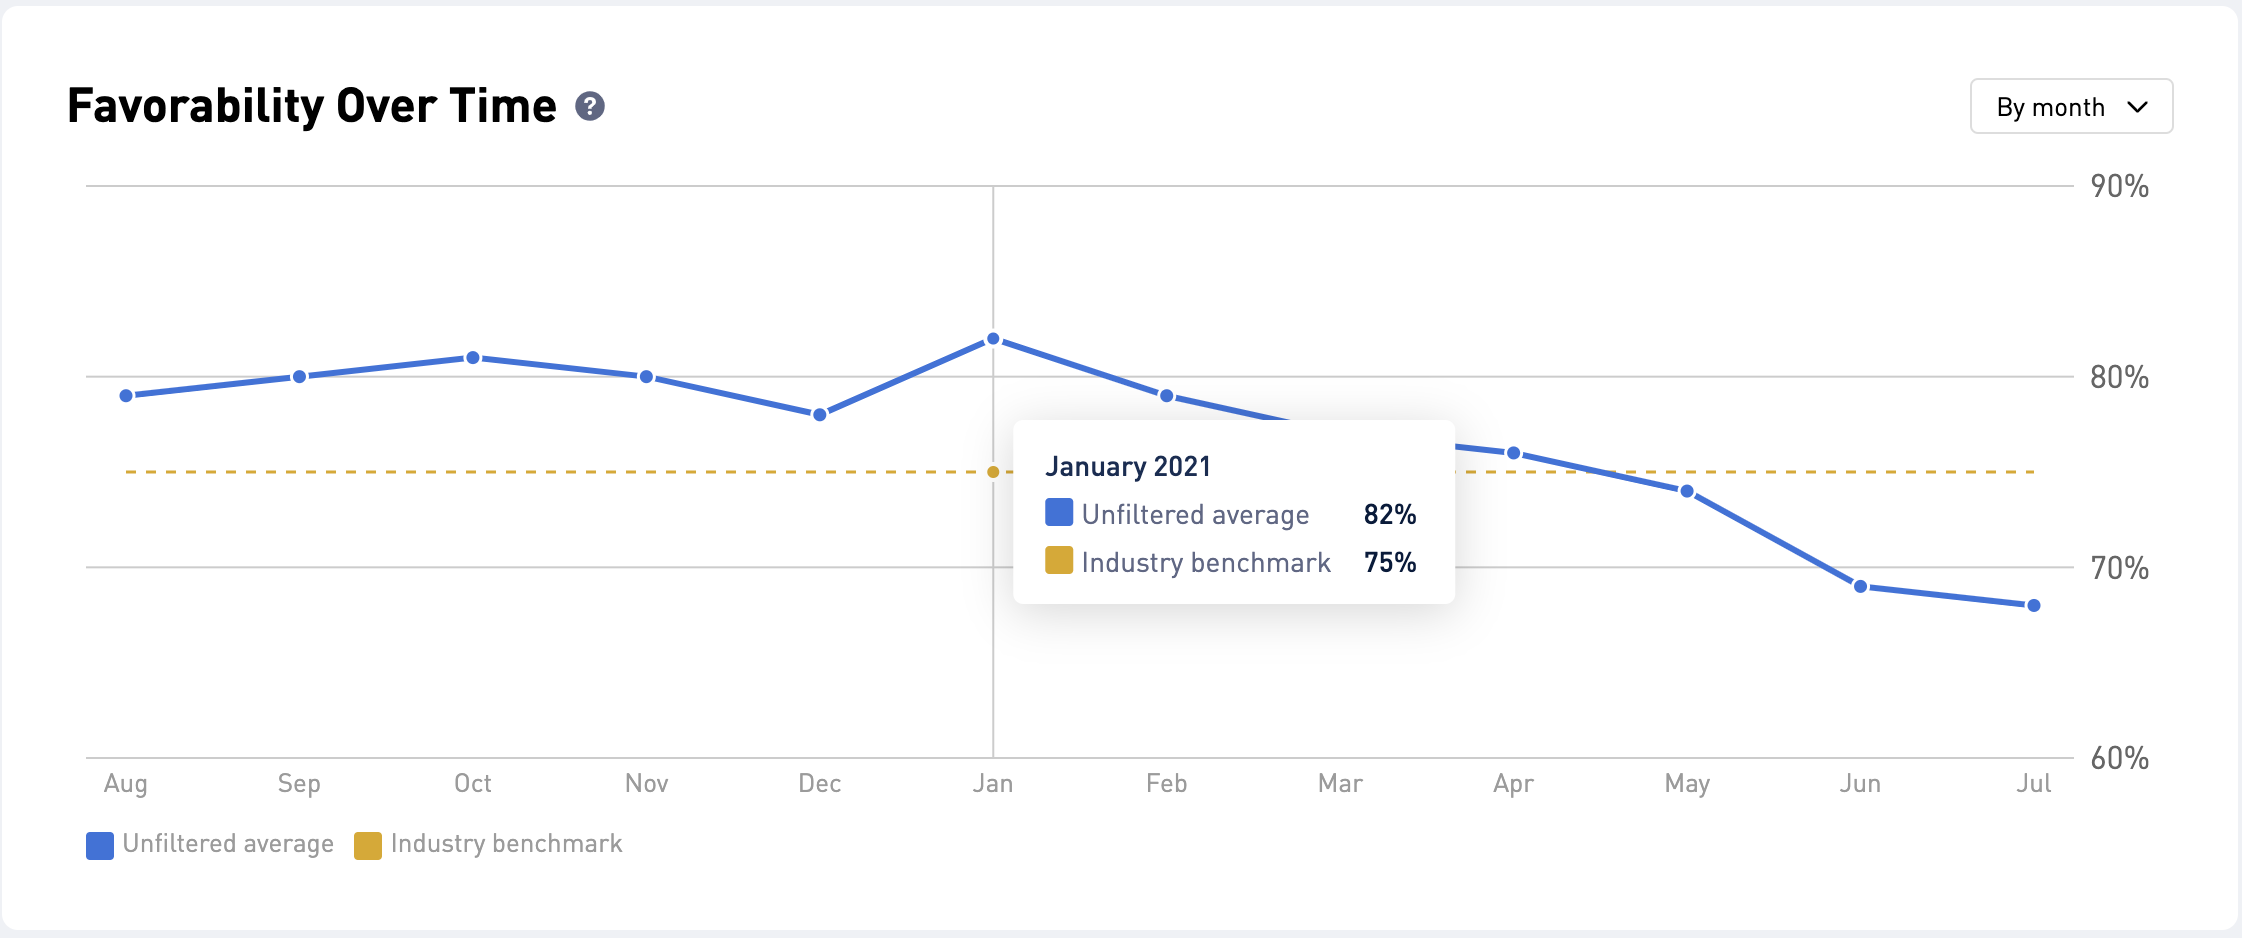
Filtered applied to Favorability Over Time: When a filter is applied to the page, you will see your filtered data set compared to your unfiltered data set. This allows you to compare a filtered data set to your entire data set.
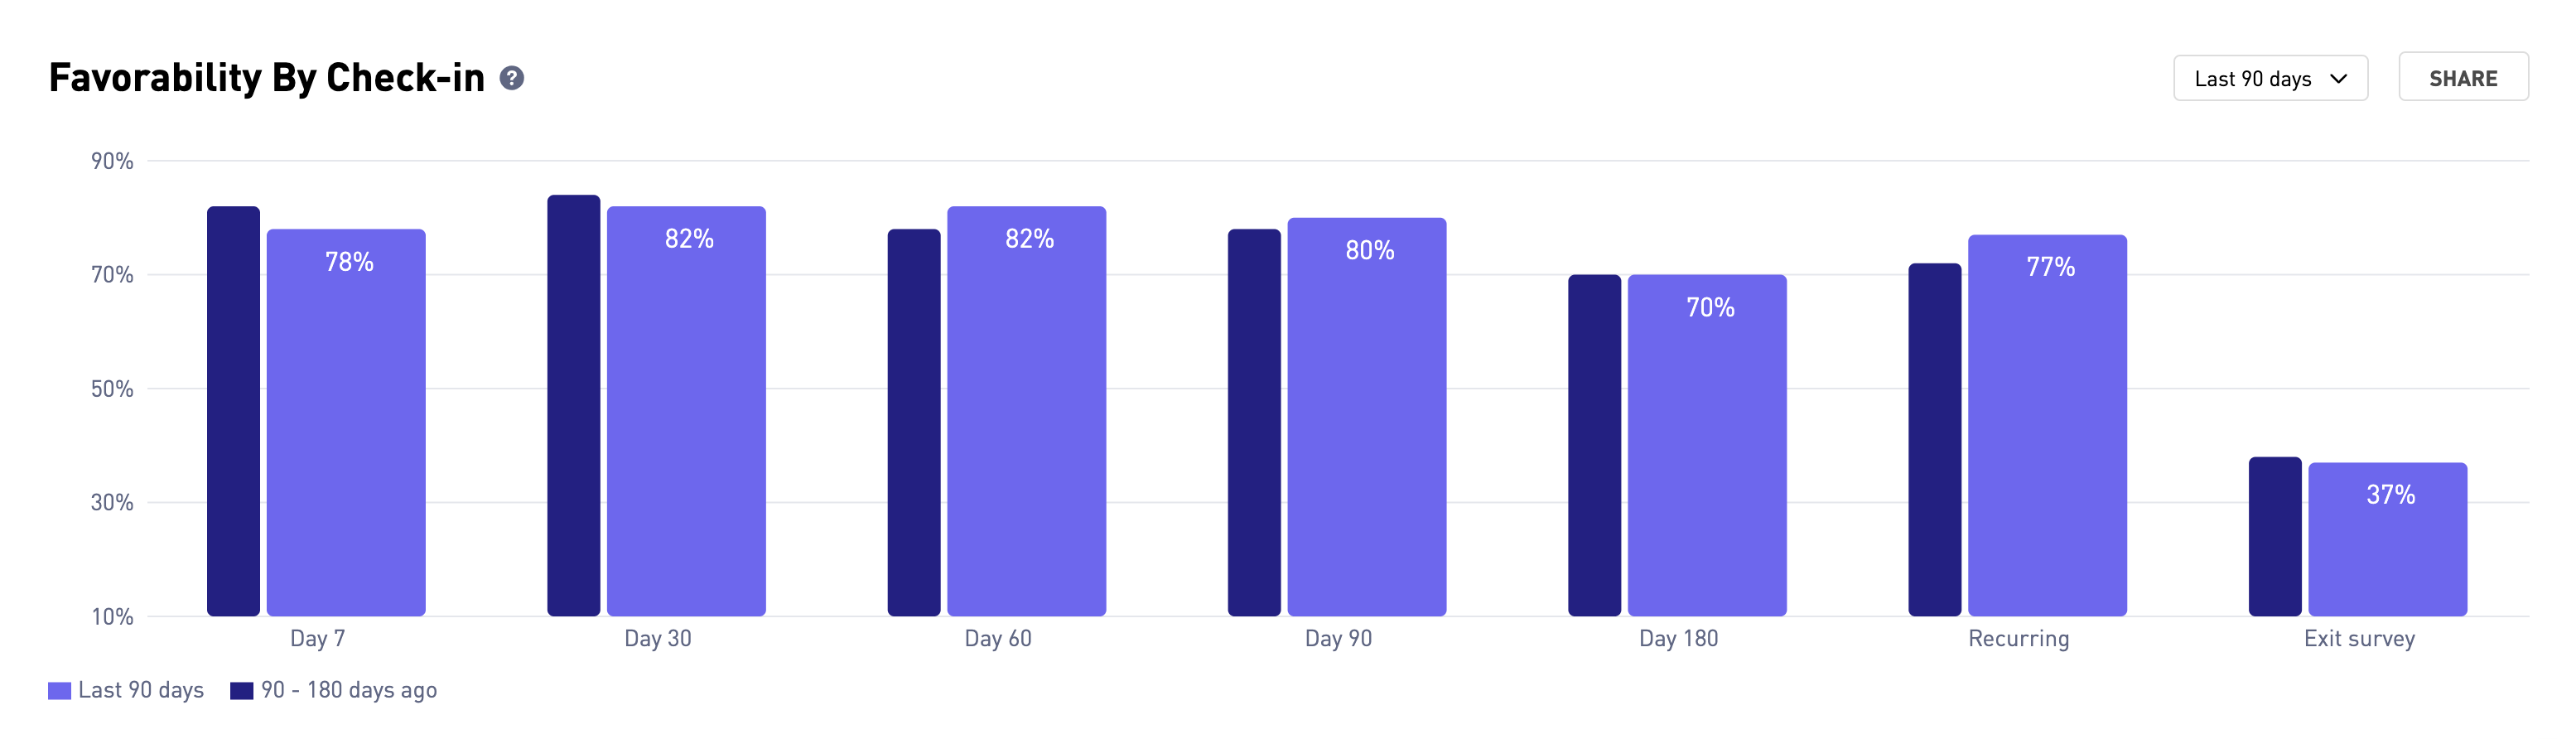
Favorability by Check-in
This chart shows you the percentage of favorable responses by check-in. This allows you to see the difference in favorability compared across check-ins. This chart compares the current period to the previous if there is a large enough sample size for each period.
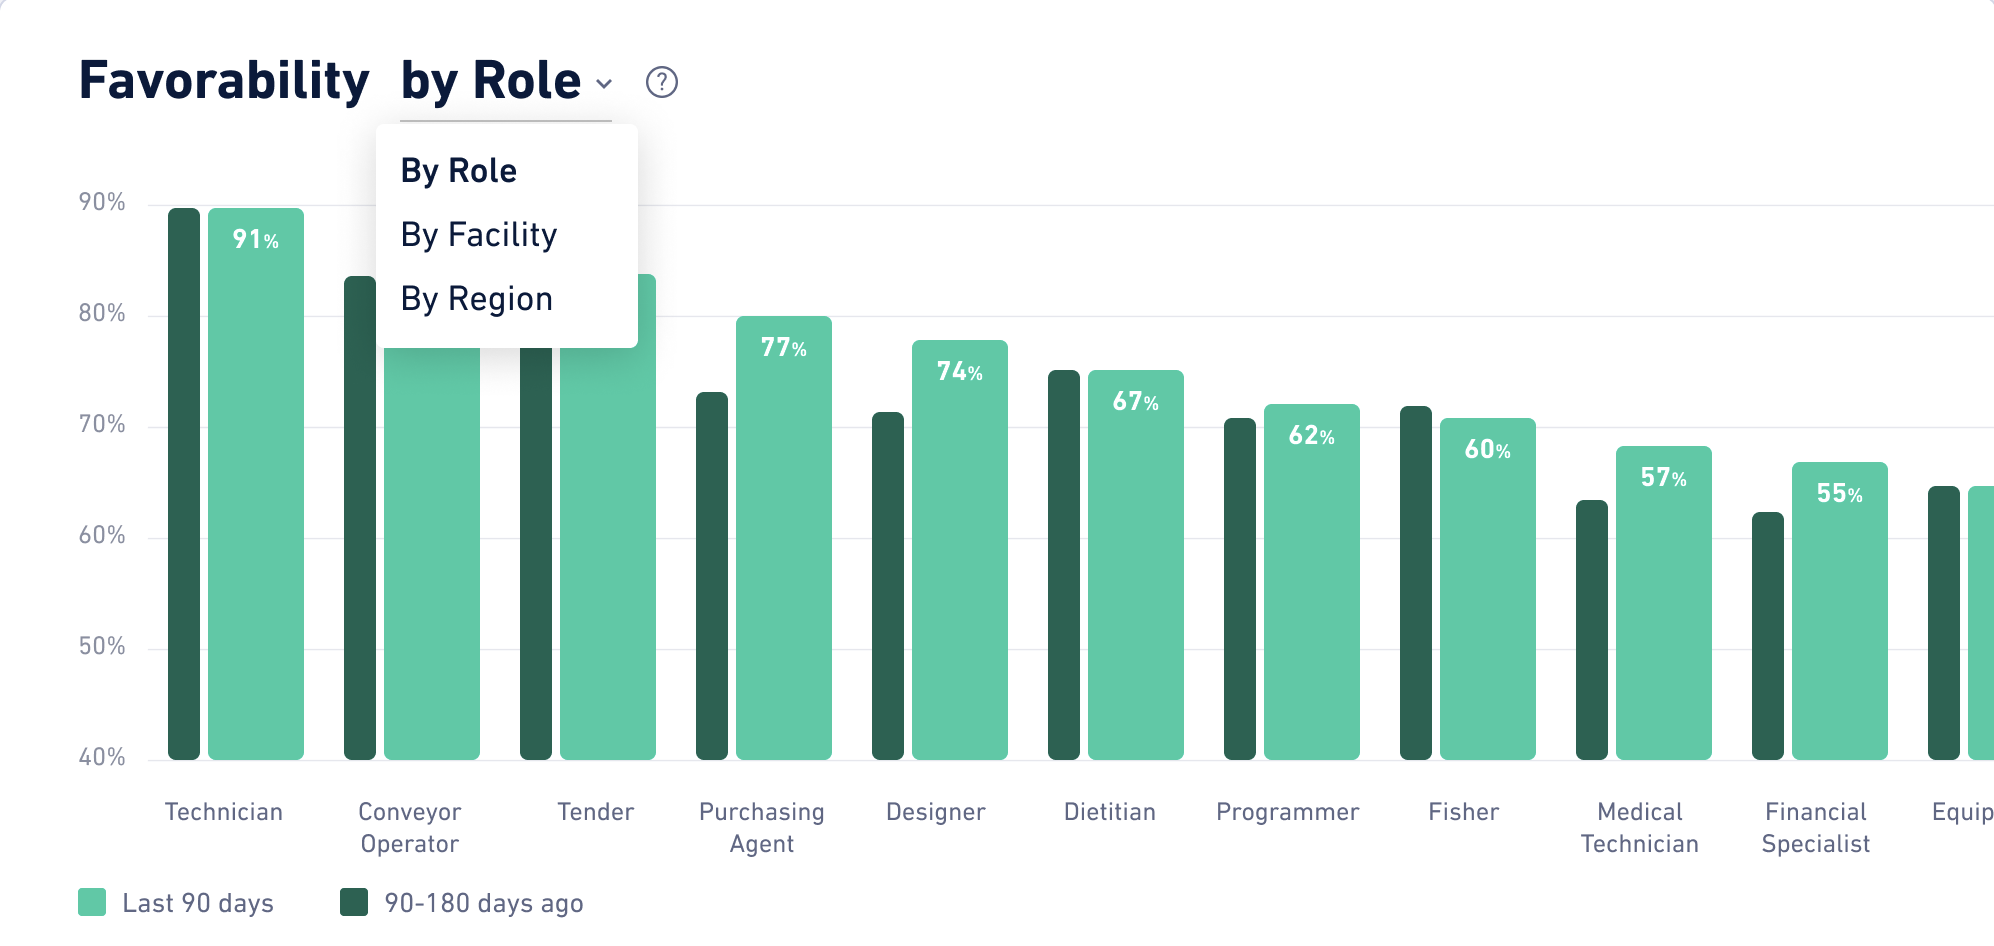
Favorability by Role or Other Option
This chart shows you the Favorability by Role, and by any other filter option you have configured. For example, this could include the option to view Favorability by Division or Location. This gives you even more ways to compare Favorability. Favorability is the percentage of responders who responded favorably to the general satisfaction question. This allows you to see the difference in Favorability by the segment you select. This chart compares the current period to the previous if there is a large enough sample size for each period.
Responsiveness
To view insights for responsiveness, select Insights, then select "Responsiveness." Responsiveness insights allow you to see your response rate over time compared to the industry benchmark. You can also see a filtered data set compared against your total data set.
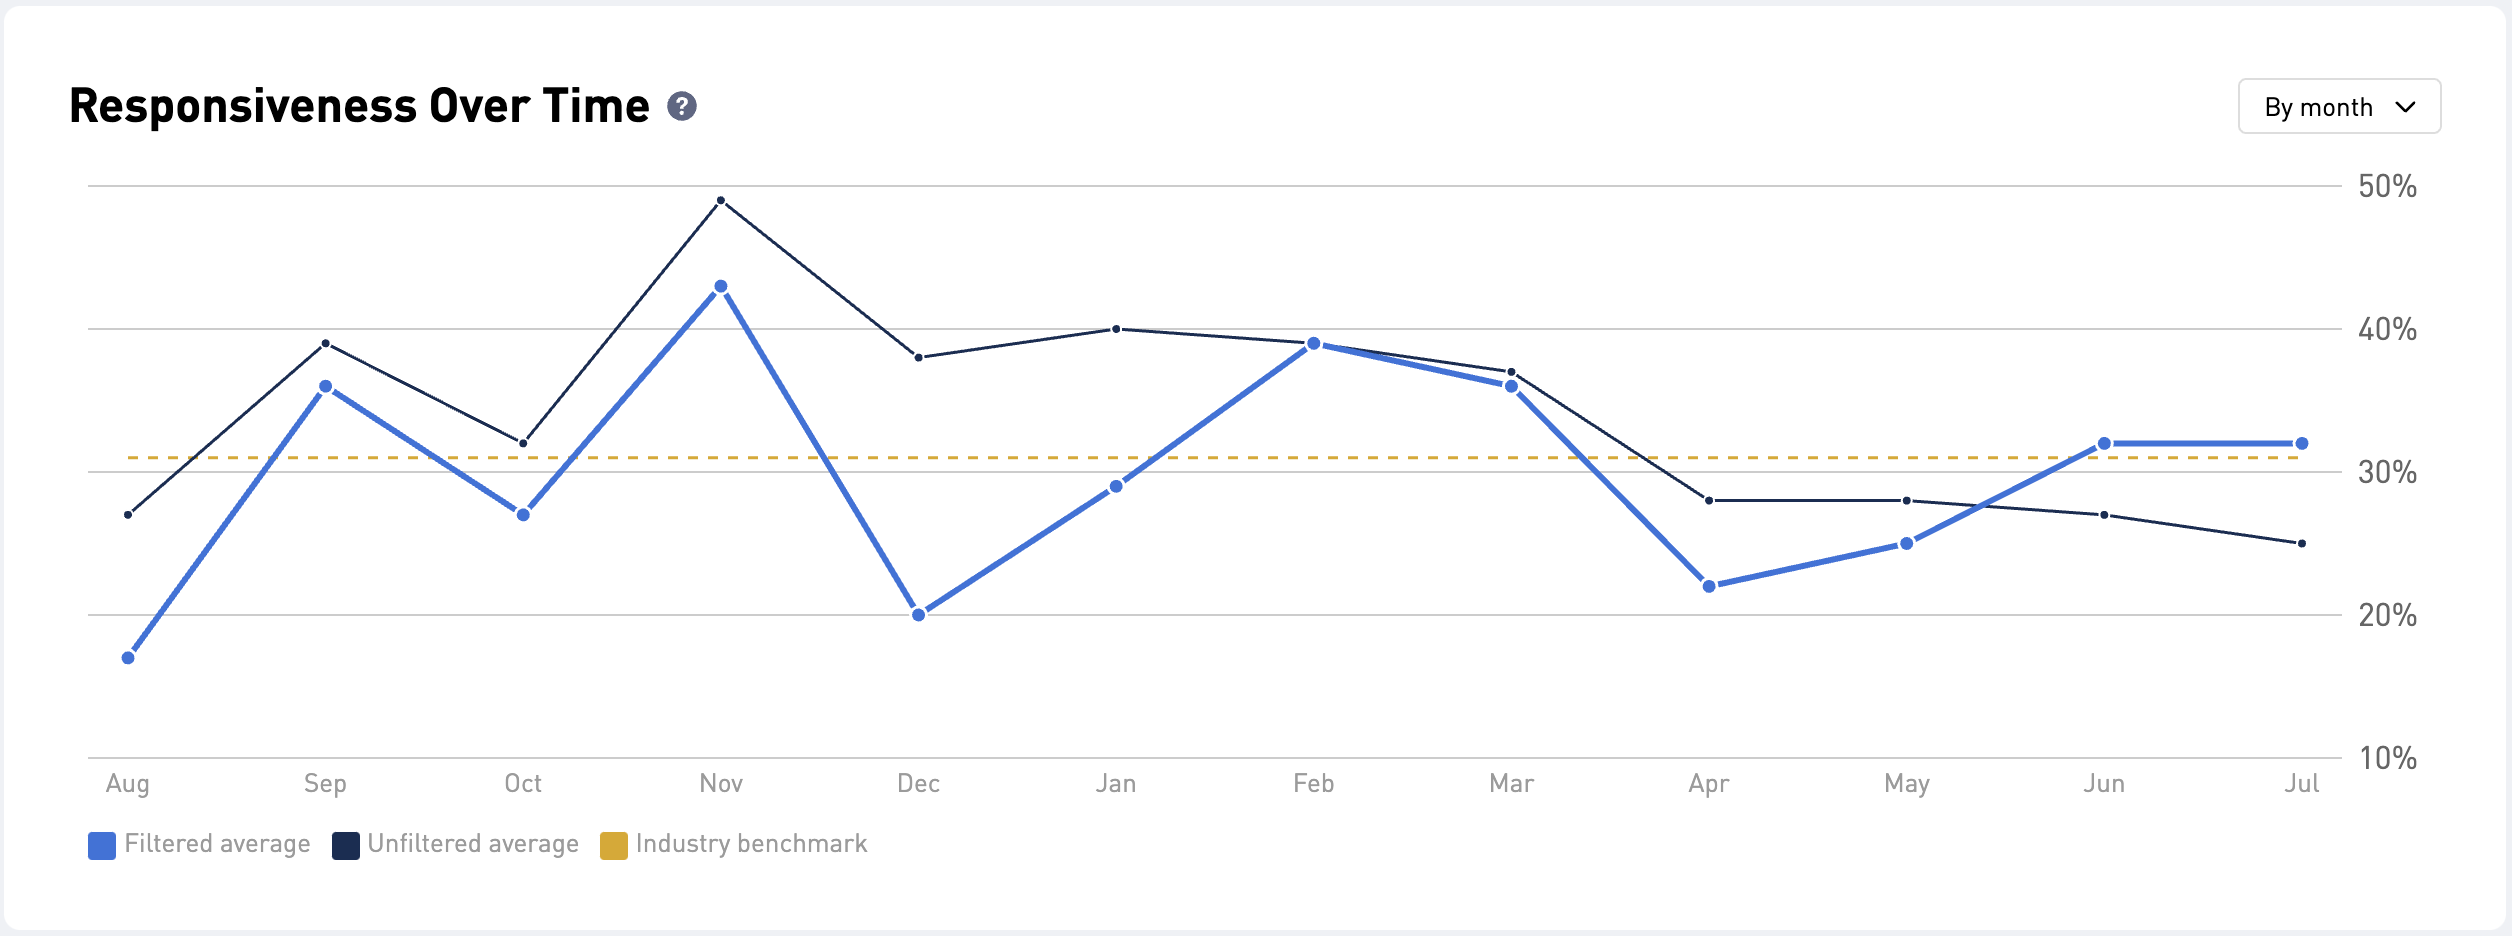
Responsiveness Over Time: The total number of respondents divided by the total number of recipients for all check-ins over time compared to the industry benchmark. This chart will also compare your filtered data set to your unfiltered data set when a filter is applied. This allows you to track responsiveness over time.
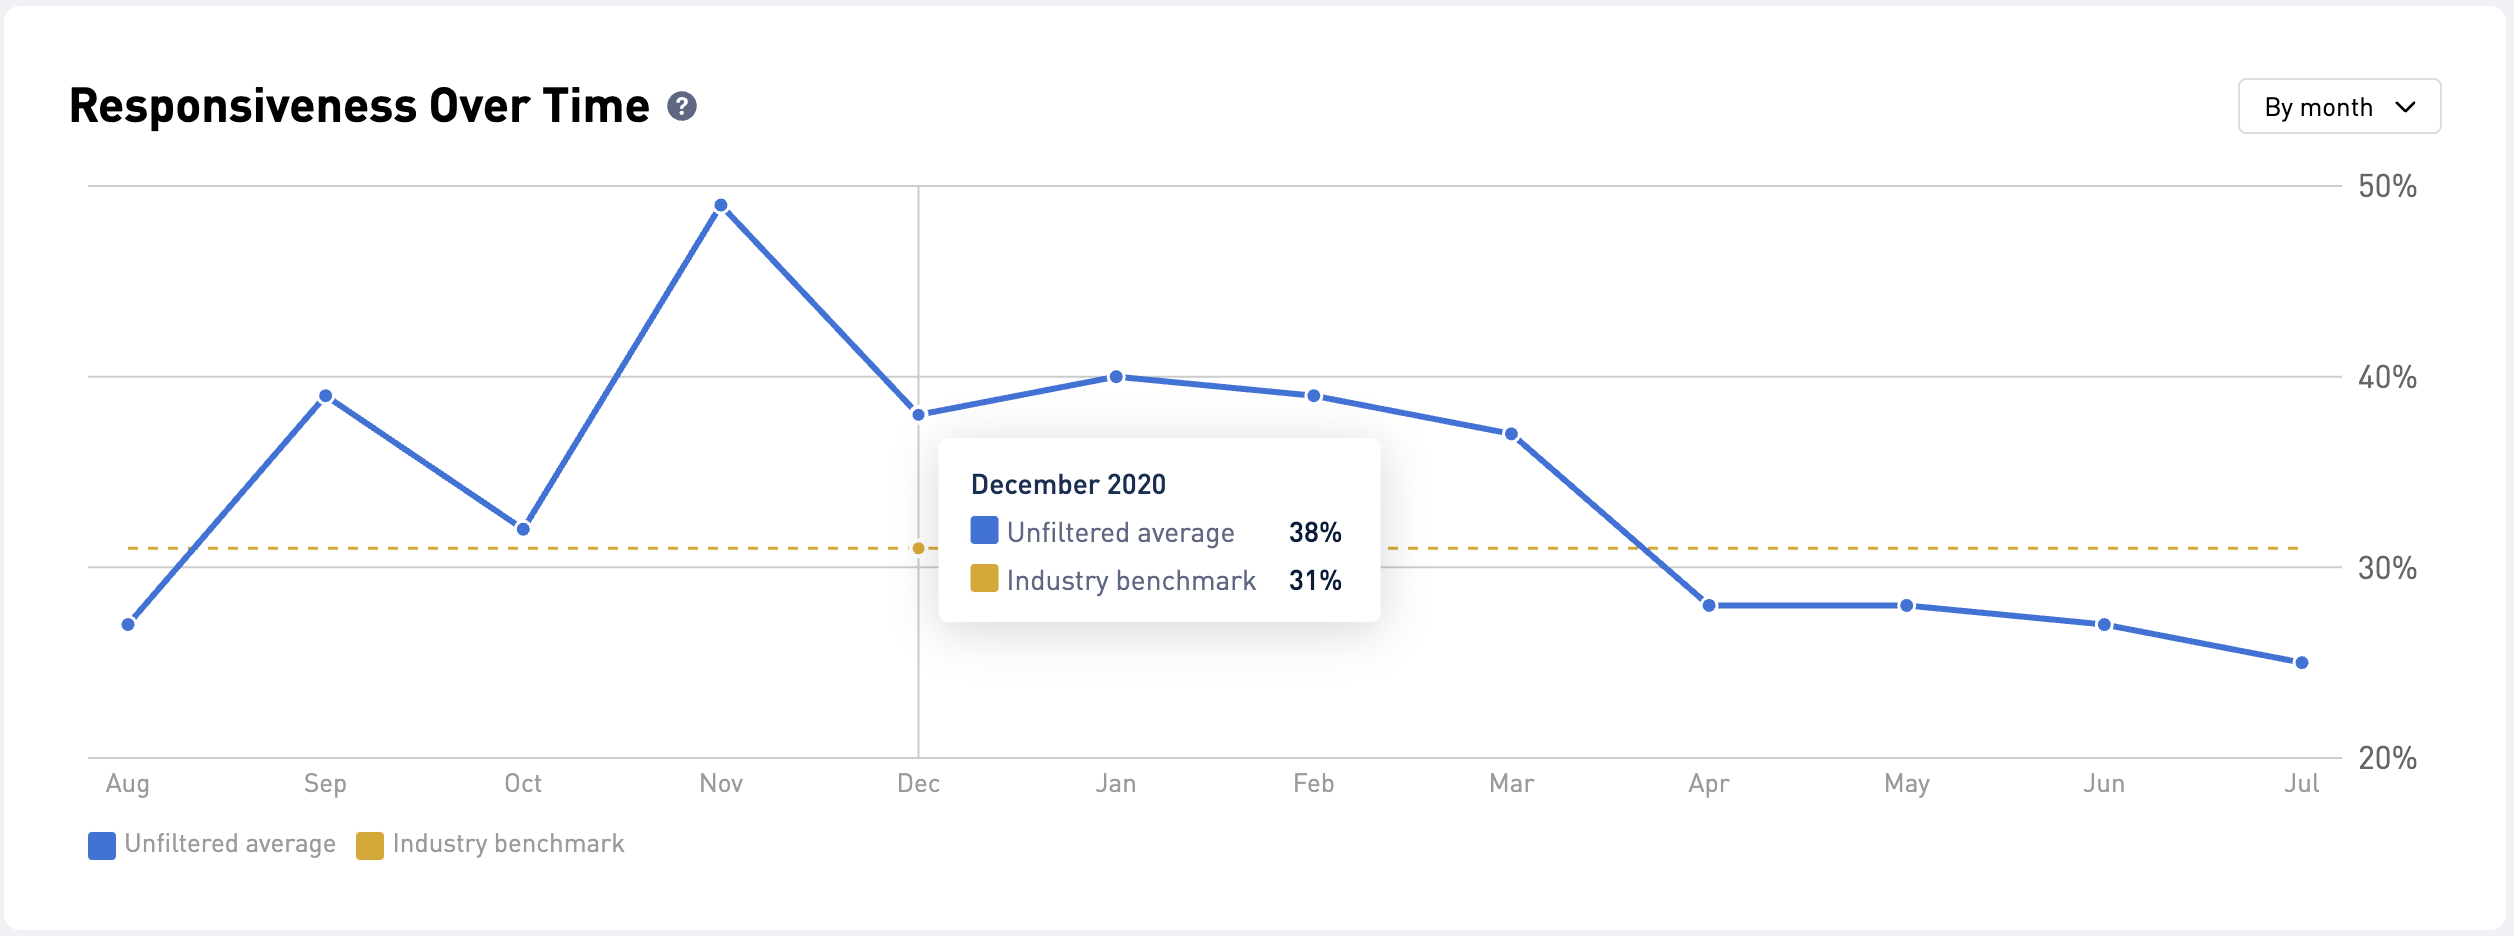
Filtered applied to Responsiveness Over Time: When a filter is applied to the page, you will see your filtered data set compared to your unfiltered data set. This allows you to compare a filtered data set to your entire data set.
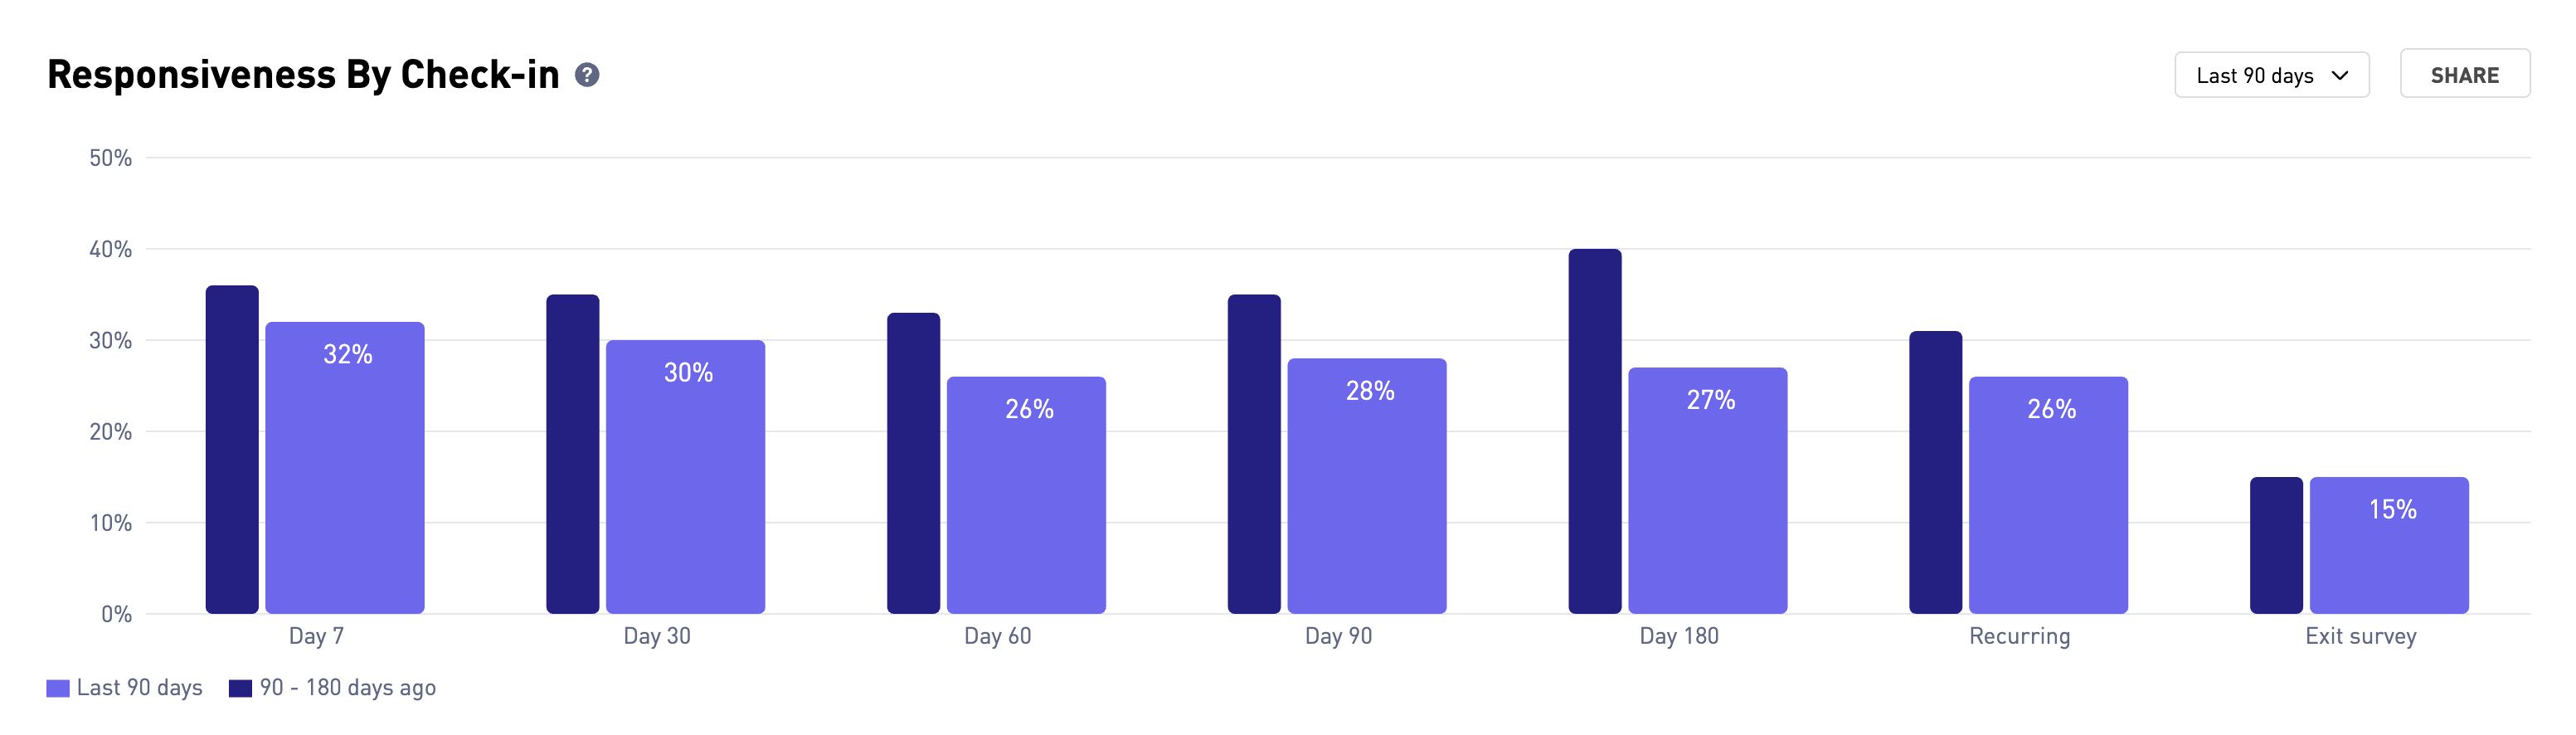
Responsiveness by Check-in
This chart shows you the response rate by check-in. Response rate is calculated by taking the number of respondents divided by the total number of recipients. This allows you to see the difference in responsiveness by check-in. This chart compares the current period to the previous if there is a large enough sample size for each period.
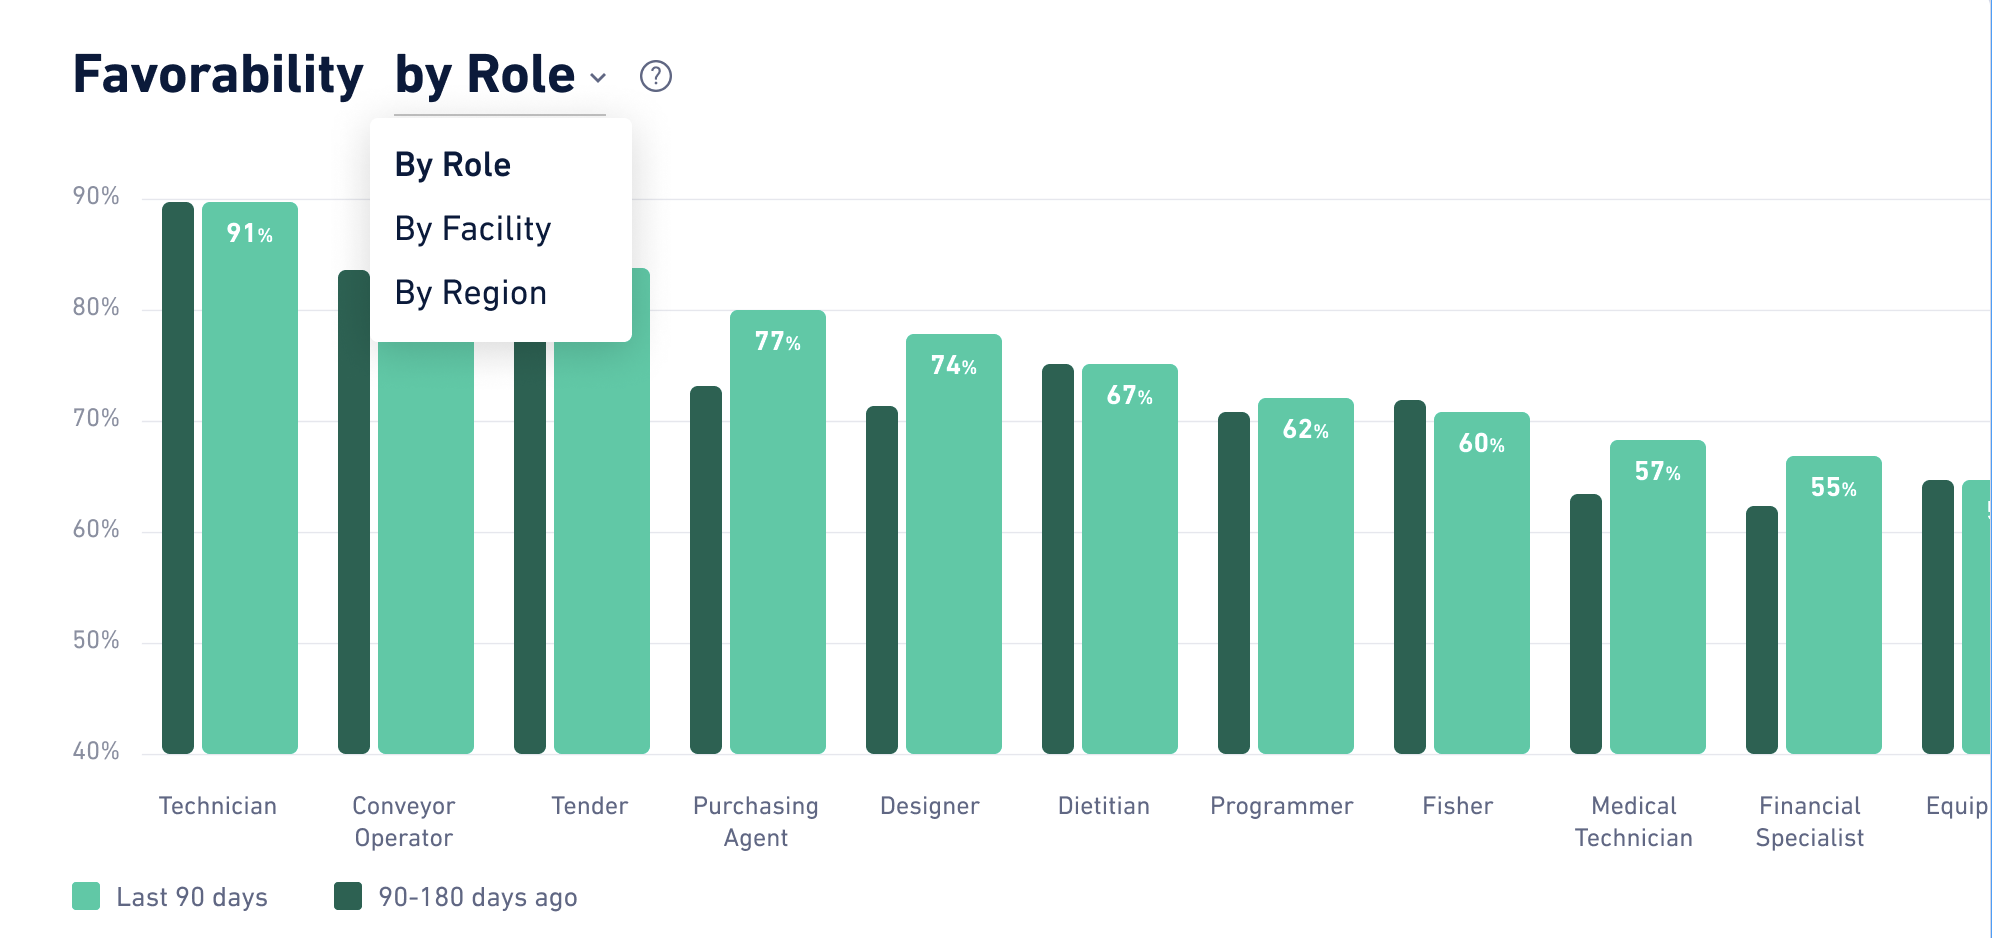
Responsiveness by Role or Other Option
This chart shows you the response rate by Role, and by any other filter option you have configured. For example, this could include the option to view Responsiveness by Division or Location. This gives you even ways to compare Responsiveness. Responsiveness is calculated by taking the number of respondents divided by the total number of recipients. This allows you to see the difference in responsiveness by the segment you select. This chart compares the current period to the previous if there is a large enough sample size for each period.
Reachability
To view insights for Reachability, select Insights from the left navigation, then select "Reachability." Reachability Insights are designed to give you visibility into the reachability of your workforce based on available contact information, bounce backs, and opt-outs. For more information visit Reachability Insights.
Retention
To view insights for retention, select Insights from the left navigation, then select "Retention." Retention insights allow you to track your retention rates over time compared to the industry average. For more information visit Retention Insights.
See Insights in action!
Open training sessions are available! Looking for some help getting started with WorkStep? In need of a refresher on best practices or feature functionality? Join us for one of our biweekly trainings by RSVPing here!