Insights: Retention
This article includes an overview of the Retention Insights page in the WorkStep RETAIN product. Retention Insights can be found by clicking on "Insights," then clicking on "Retention."
How is Retention calculated in WorkStep?
Retention is calculated by dividing the number of active employees at the beginning given period by the number of employees who terminated in the same period. This requires a complete period of time to make the calculation for that time period. For monthly retention, if you have 50 active employees at the start of the month, of those 50, how many employees are still active at the end of the month. If it was 40, the retention rate for the period would be 40/50 = 80%.
Retention Rate Over Time - Standard Retention By Month or By Quarter
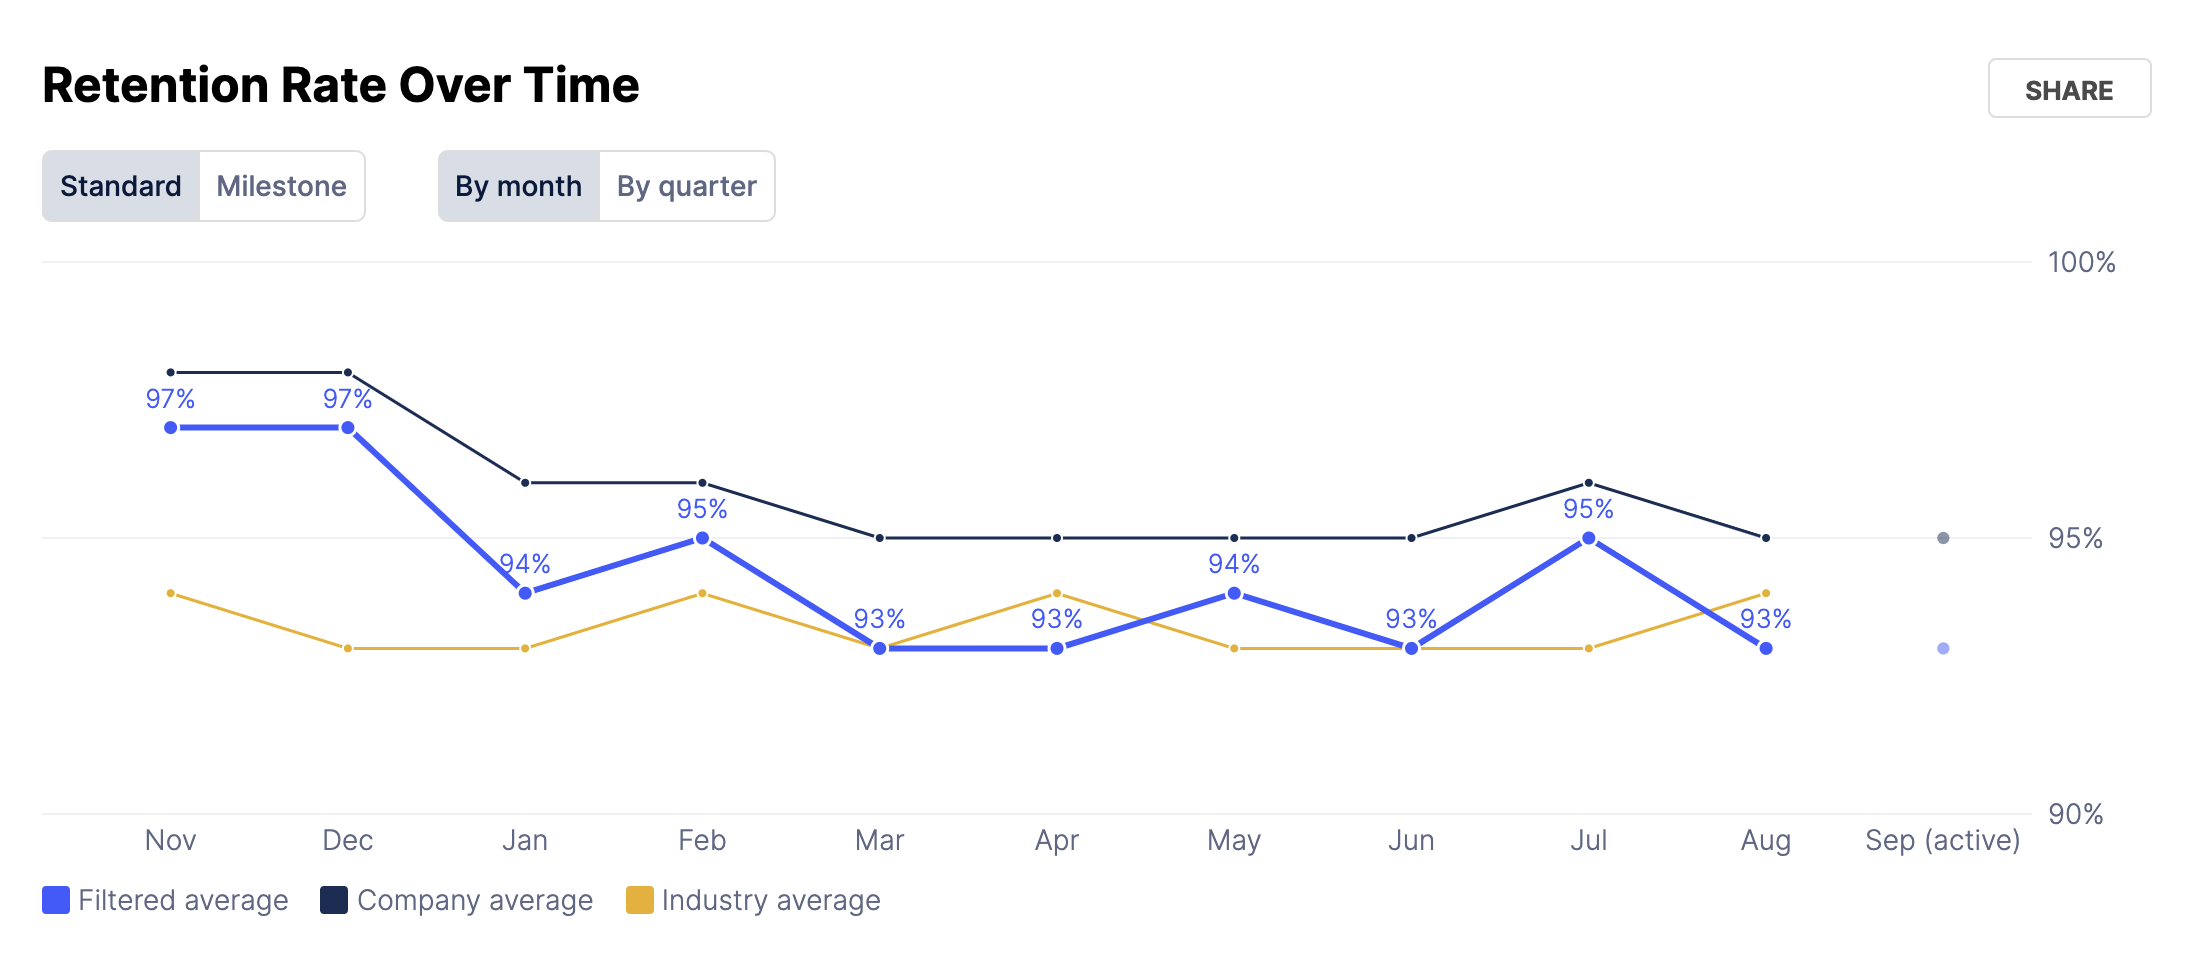
This is calculated by the total number of employees from the start of the period and deducting how many employees retain through the end of the period. The same method can be applied for quarterly retention.
Retention Rate Over Time - By Milestone
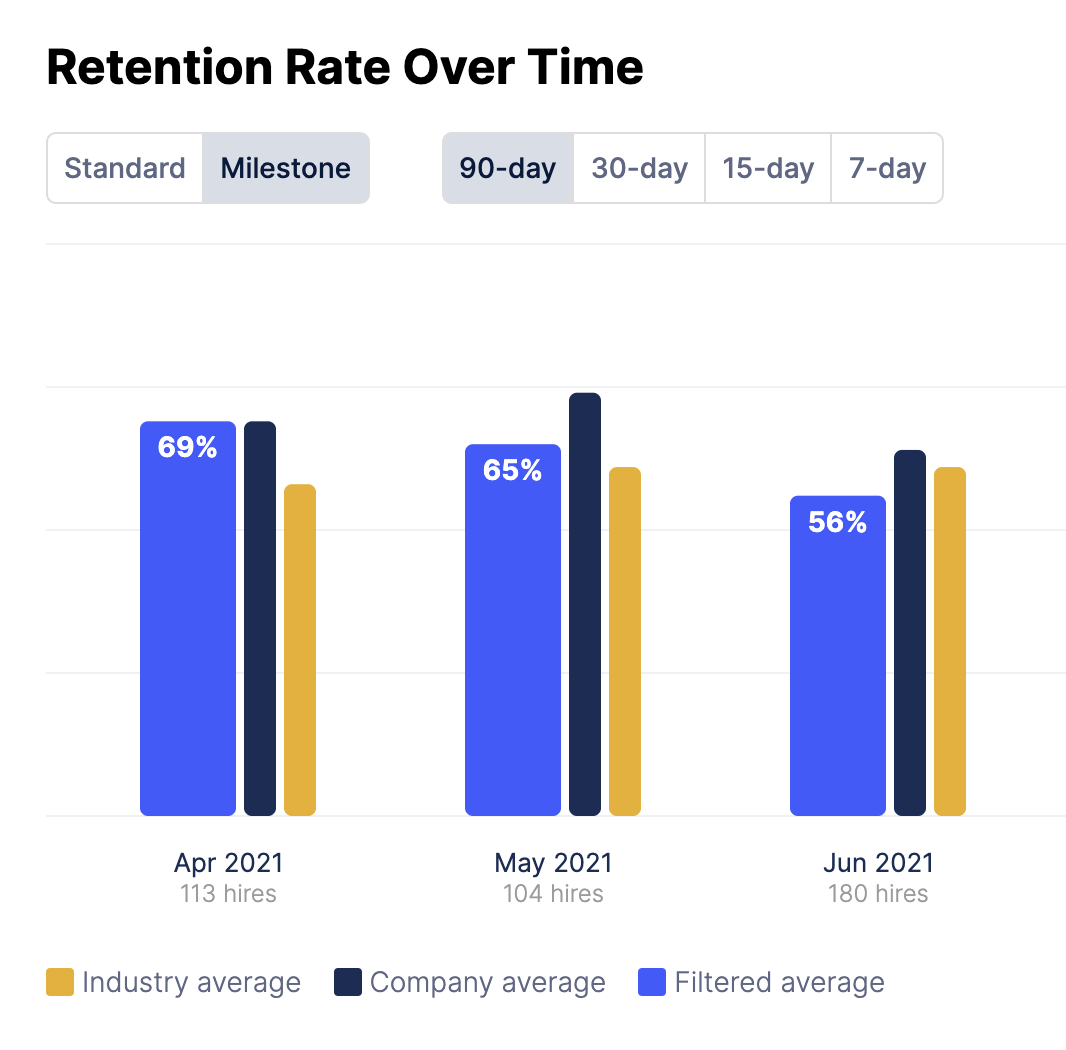
This is calculated by taking the number new hires for the time period divided by the number of terminated employees for that time period. As an example, 7-day retention in February is asking “how many hires in February lasted at least 7 days?” And the same thing for the other time ranges.
Leading Indicators of Retention Rate
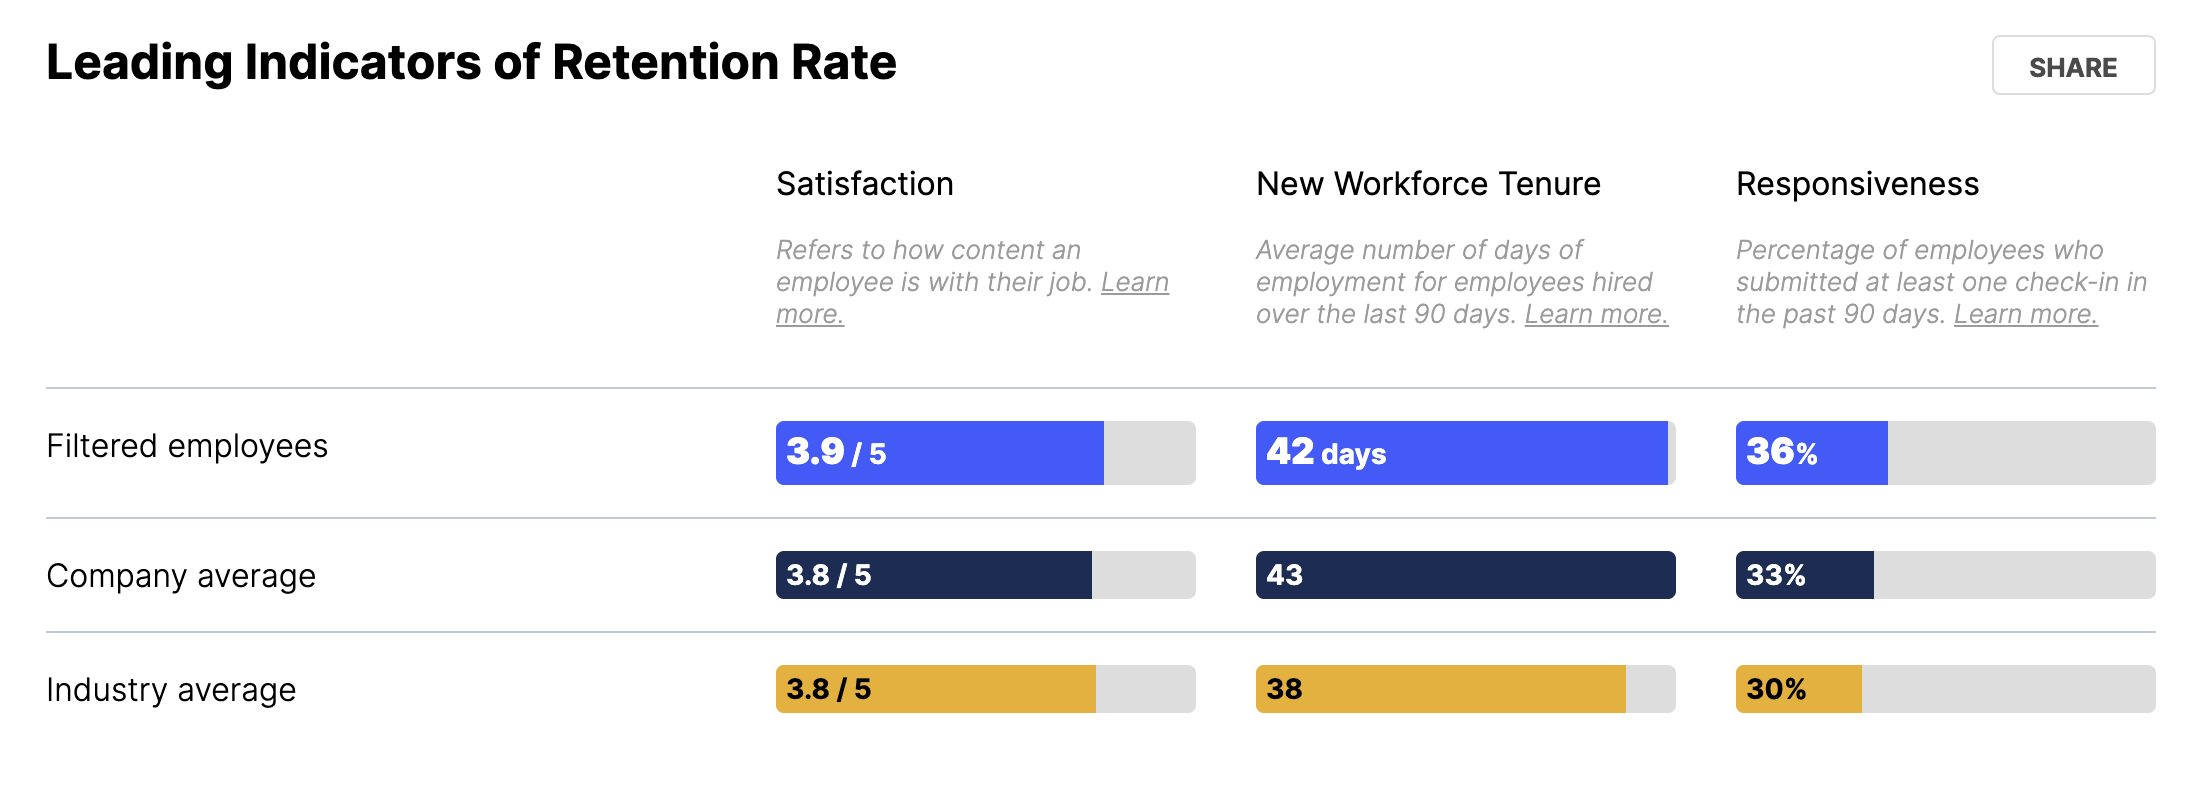
Satisfaction
Satisfaction is calculated by the average rating of check-in responses to “satisfaction” questions (i.e. “How would you rate your first week?”) from the last 3 months. This is unique per hire (i.e. if we’ve sent a hire a 7-day and 30-day check-in during this period, we’ll use the most recent response we’ve received from them).
New Workforce Tenure
The average tenure of hires from the last 90 days.
Responsiveness
Percentage of unique hires we’ve sent check-ins to in the last 3 months that have responded.
Hiring and Turnover Breakdown
This data is calculated by taking all the hires from the selected time period and figuring out what their retention is.
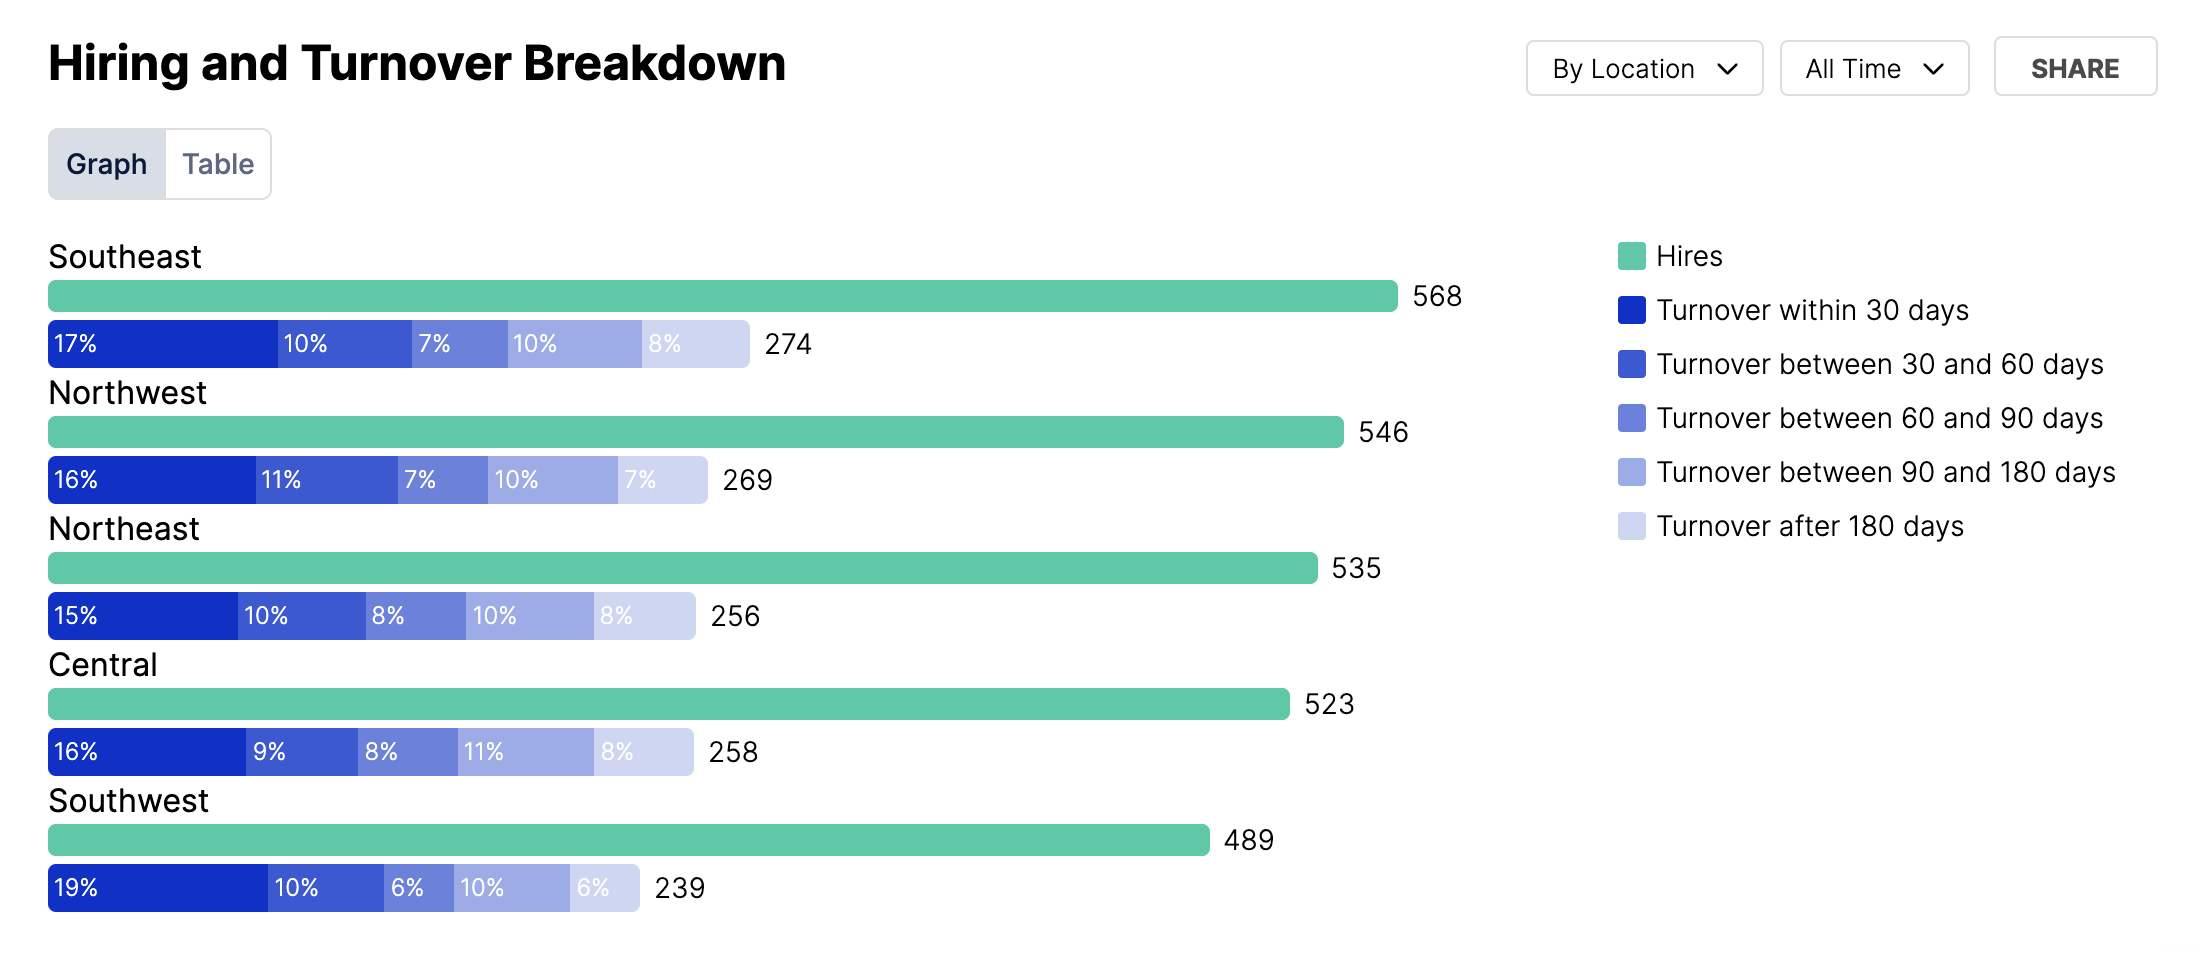
In the above graph, the teal bar indicates the total number of hires, and the blue bars underneath represent the terminations. The termination bars are color-graded based on when the term occurred (see the legend for exact specifics), and sized based on the percentage of the overall hires it accounts for.
For instance, if you had 50 total hires and 10 terminations in less than 30 days, the dark blue bar would be 20% of the size of the teal bar (10/50 = 20%).
These are currently sorted by the location or role type that has the most hires. Using the filters at the top of the page will allow the data to change based on what the new “top-level” filter becomes. For instance, if you selected the West division, this graph will show all markets underneath the West division.
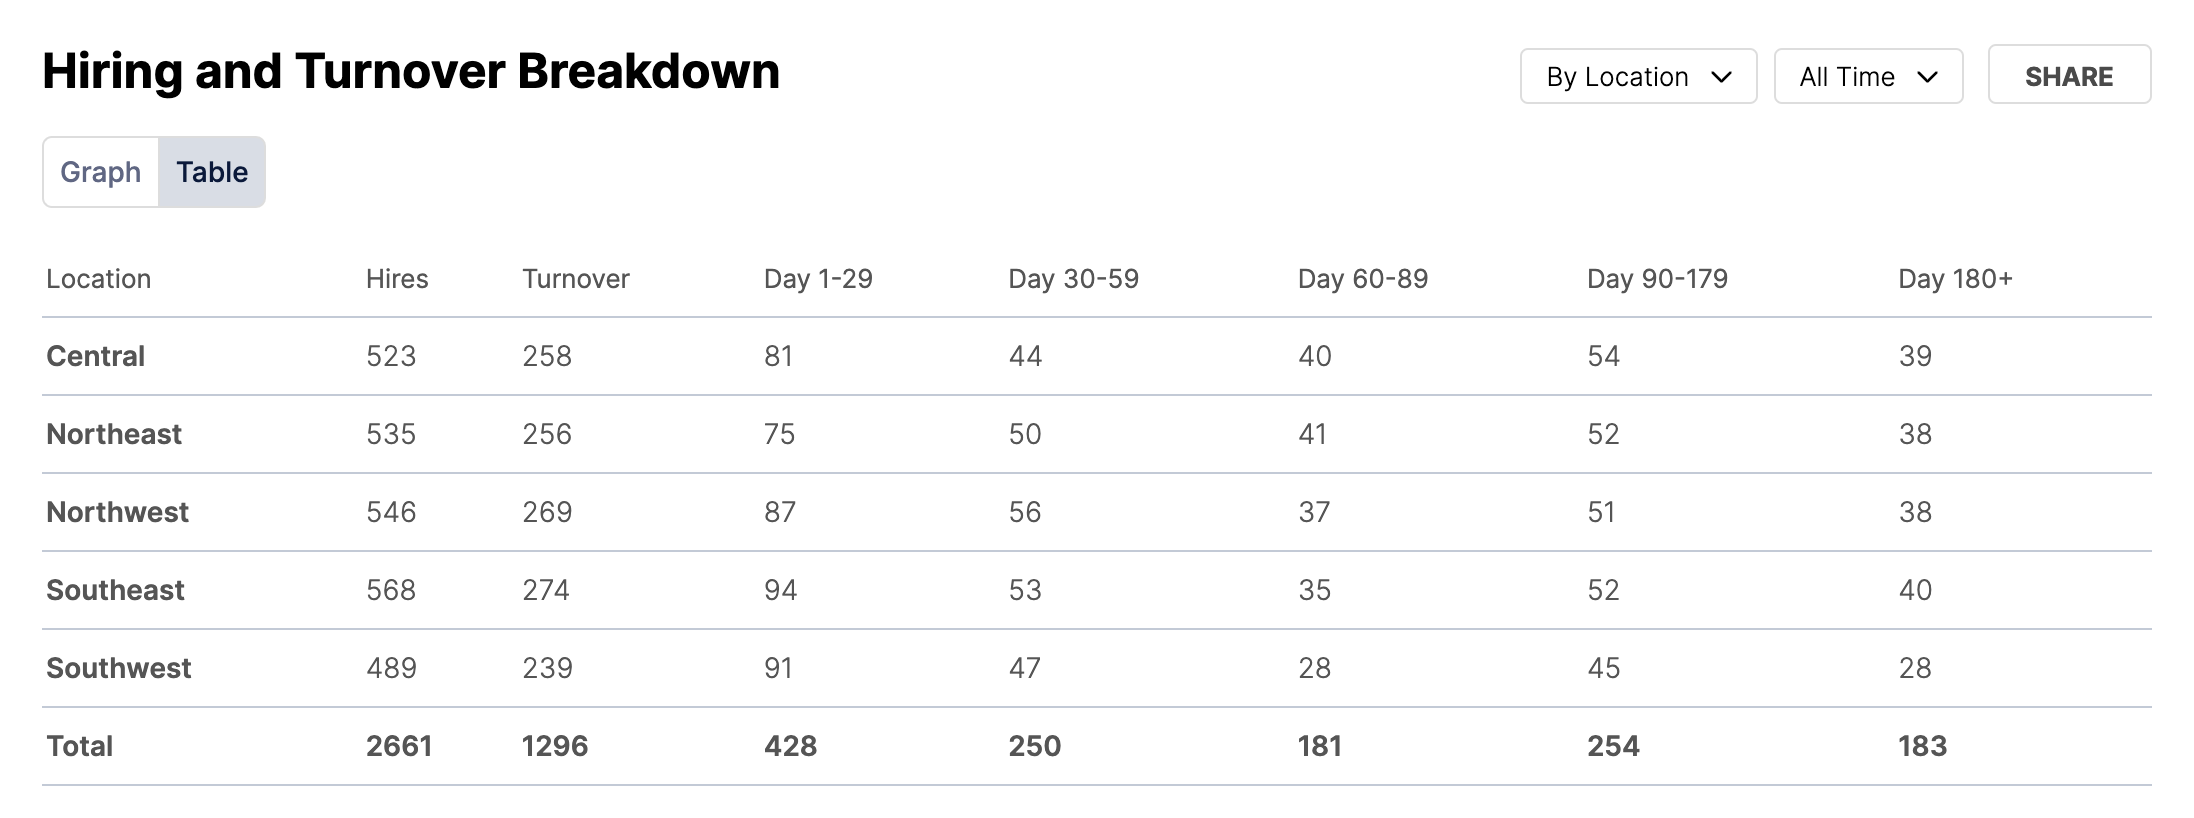
This table shows the data from the graphs in a tabular format.
Retention Insights FAQ
- Q: Why are my Retention charts blank? A: Retention takes a longer time to calculate than Favorability. If you have just started using WorkStep RETAIN it's possible that you don't have enough data to populate these charts for the selected time period. You can shorten your time period or talk to your WorkStep representative about importing historical termination data.