Reports

What are Reports:
WorkStep’s reports are designed to help you synthesize and view WorkStep data in one place. With reports, users can view and edit existing reports, and create new reports.
Our Reports feature offers two types of reports:
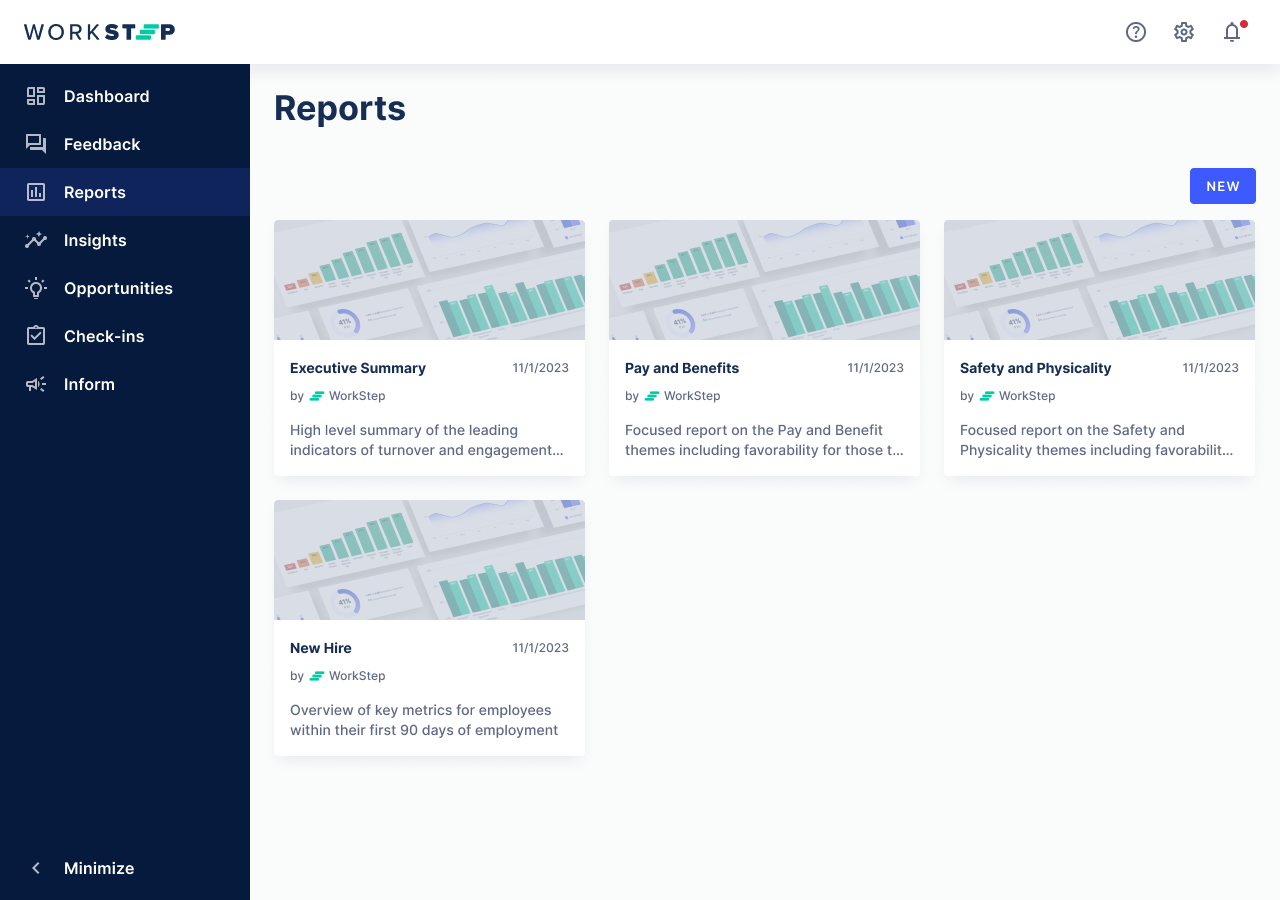
Standard Reports: WorkStep generated reports covering the most common areas of interest. Standard Reports include: Executive Summary and New Hire. Additional Standard reports will be released during the Early Access Program. Standard Reports cannot be edited directly, but users can duplicate a Standard Report and then make edits. This new report will automatically save in the Reports menu.
How to duplicate a standard report
- Open the Report
- Select the Duplicate icon from the upper right-hand menu
- Select Duplicate
- Begin to edit the report (eg: change title, edit filters, add or remove graphs)
- The new report will automatically save in the reports menu
- If the report is not renamed, the new report will be distinguishable from a WorkStep generated Standard report because Standard reports say “By WorkStep” in the preview
- Custom Reports: User-generated reports. A custom report lets users create a report with whatever WorkStep data they wish to include. This report will automatically save in the Reports menu, and can be viewed or edited at any time.
- Custom Reports are only visible to the user who created them and no other WorkStep users from the same organization.
User Access:
All WorkStep users have access to the Reports page, with 2 standard reports and the custom report builder. Reports will only reflect data from within a user’s scope.
How to build a Custom Report:
Navigate to the “Reports” page from the left-hand side menu on the platform. From the Reports menu, select “New.” Now the user can name the report, add a description, and begin building a new custom report.
Add Cards to the report and select how to populate them.
- Select filters at the top of the report builder to apply to the entire report and also filter at a card-level.Report-level filters are prioritized over component-level filters
- Filters are narrowed from left to right only. (eg: a State filter will reduce the selections for a City filter, but selecting a City filter will not reduce the selections in the State filter)
- Attempting to set component-level filters outside of the Report-level filters will result in no data being displayed (eg: Report-level filter selected State: California but at a component-level user selects Country: Canada; no data will be shown)
- Cards, which will each represent an individual PPT slide when exported, contain one component, which can be either a graph, single metric, or open text. Data components in reports are the same data that exist throughout the WorkStep platform. Components that can be included in your custom reports are:
- Favorability by Theme, Matrix
- Favorability by Theme, Column
- Favorability Over Time
- Favorability by Attribute
- Favorability Overall
- Favorability by Check-in
- Favorability by Question, By Answer
- Favorability by Question, By Check-in
- Retention Rate Over Time
- Retention Rate by Milestone
- Turnover Rate Over Time
- YTD Turnover Rate
- Hiring and Turnover
- Responsiveness Overall
- Responsiveness Over Time
- Responsiveness by Attribute
- Responsiveness by Check-in
- eNPS Overall
- eNPS Over Time
- eNPS by Check-in
- eNPS by attribute
- Trending Topics
- Alert Stats
- Add a card with the + button at the top right or from the bottom of the report
- Select the component using the drop-down menu
- Then select the filters to apply to that card, including the date range filter
- Customize the title of the card, otherwise a default title will populate
- As users build a report, card names will appear on the left-hand menu while the cards stack within the report
- Drag and drop the card from the left-hand side menu of the report builder to determine the order the cards appear in on the report at any time
- Edit or delete cards either by selecting the ellipse from the left-hand menu, or from the card directly
- The report auto-saves as cards are added or any changes are made
- Reports have a limit of 50 cards per report
- Preview the report with the Eye icon at the top right menu
- The new report will appear in the Reports menu. This report can be viewed and edited again at any time
The Report Builder has two modes:
Preview: This is the default view when a report is opened. While the Report is in Preview mode:
- A Title & Description Card appears at the top of the Item Stack
- Cards can only be viewed, and their Components interacted with, but not manipulated
Editing: Access this mode by building a new report, duplicating a Standard report, or by selecting the pencil icon to edit any existing custom report. While the Report is in Edit mode:
- A Title & Description Card appear at the top of the Item Stack
- The Title & Description Card cannot be deleted, duplicated, or moved - only edited
- Other Cards can be added, edited, duplicated, deleted, or previewed individually by selecting the icons in the bottom right of the card
- Preview a Card independently by selecting the Checkmark Icon; edit the card again by selecting the Pencil icon.
Export Reports to PPT:
We’ve optimized report exports for Microsoft PowerPoint, but users can also open their exported reports in other applications such as Keynote or Google Slides (although things like font and formatting may vary). After downloading a report as PPT, the report can be exported to pdf from the users’ presentation program.
Export any Report to PowerPoint by:
- From Preview Mode: Clicking the Download icon
- From Editing Mode: Clicking the 3 dots from the top-right menu and selecting Download
When the report is exported, the file name will follow this format: workstep-report-report-title-YYY-MM-DD.pptx
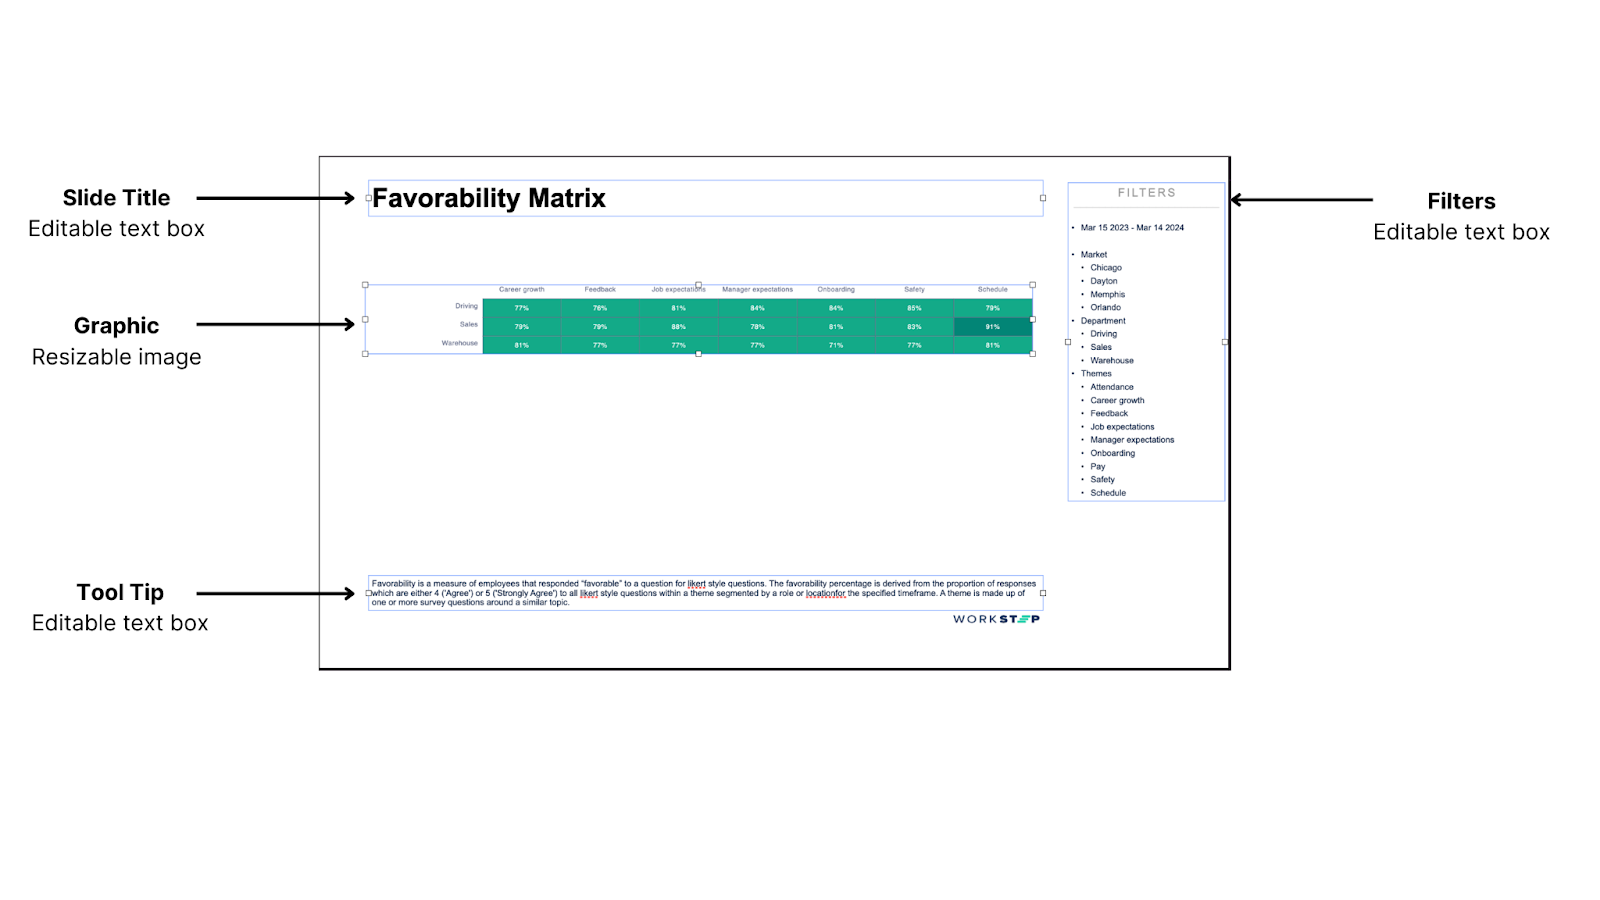
Exports will contain one slide for every card in the report as well as a title slide for the Title & Description card that will also include the name of the user who initiated the export and the date the report was exported.
Component slides will contain the component title, filters text box, graph image, and tool tip text box. Text fields are exported as individual text boxes in PowerPoint and can be edited or deleted. Graph images are exported as images and can be resized, cropped, or deleted.
Additional Export Notes:
Report exports include:
Report Name
- Text box
WorkStep logo
- Image, part of Theme
The name of the user who created the report or an indication that the report was created through a WorkStep template
- Text box
Full view of the graph in each card
- Image
Indication of the filters applied
- Text box
Tool tips explaining what the metric is (ie: defining how favorability is calculated)
- Text box
Question copy if the component is filtered for one or more specific questions
- Text box
Reports download with a minimal Theme applied that includes the WorkStep logo. Users can update or swap out the Theme once they’ve opened the file in their preferred application
Example Slide