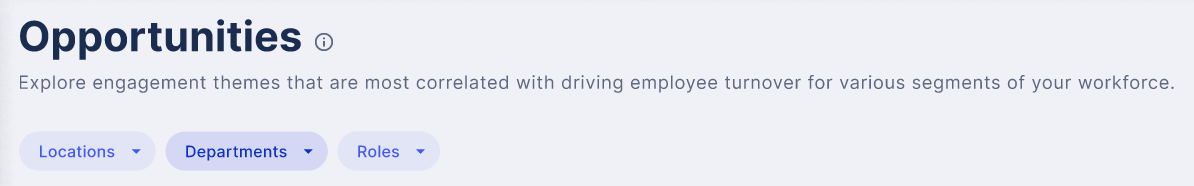
Opportunities
When leaders start thinking about investing in turnover reduction, it’s hard to know which initiatives will have the biggest impact. We built the Opportunities page to turn data into actionable insights by highlighting the areas to focus on. Here, WorkStep will present opportunities for improvement based on your comparison to the industry as well as Turnover Reduction opportunities calculated based on your data.
The Opportunities page has themes organized into three sections, Opportunities for Improvement, Average, and Keep up the good work.
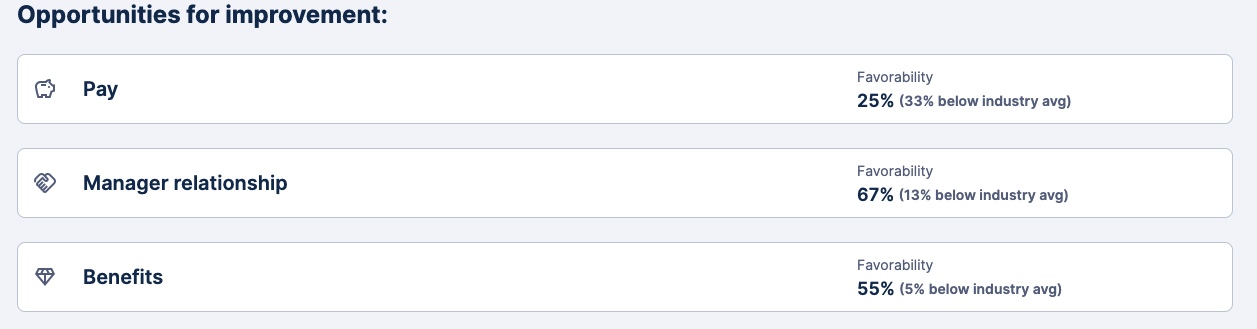
Opportunities for improvement
A theme qualifies as an ‘Opportunity for improvement” if it meets one of these criteria:
- areas where your favorability score is in the bottom third percentile of the industry. Favorability scores below the 33rd percentile.
- if the turnover reduction score is above a mid-level threshold.
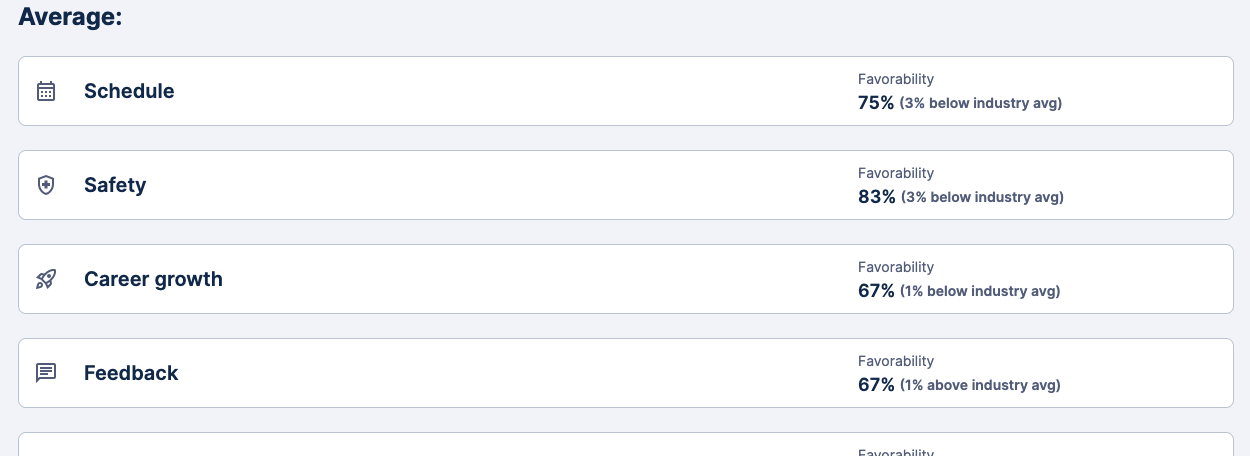
Average
Areas where your favorability score is in the middle third percentile of the industry average. Favorability scores between the 33rd and 66th percentile.
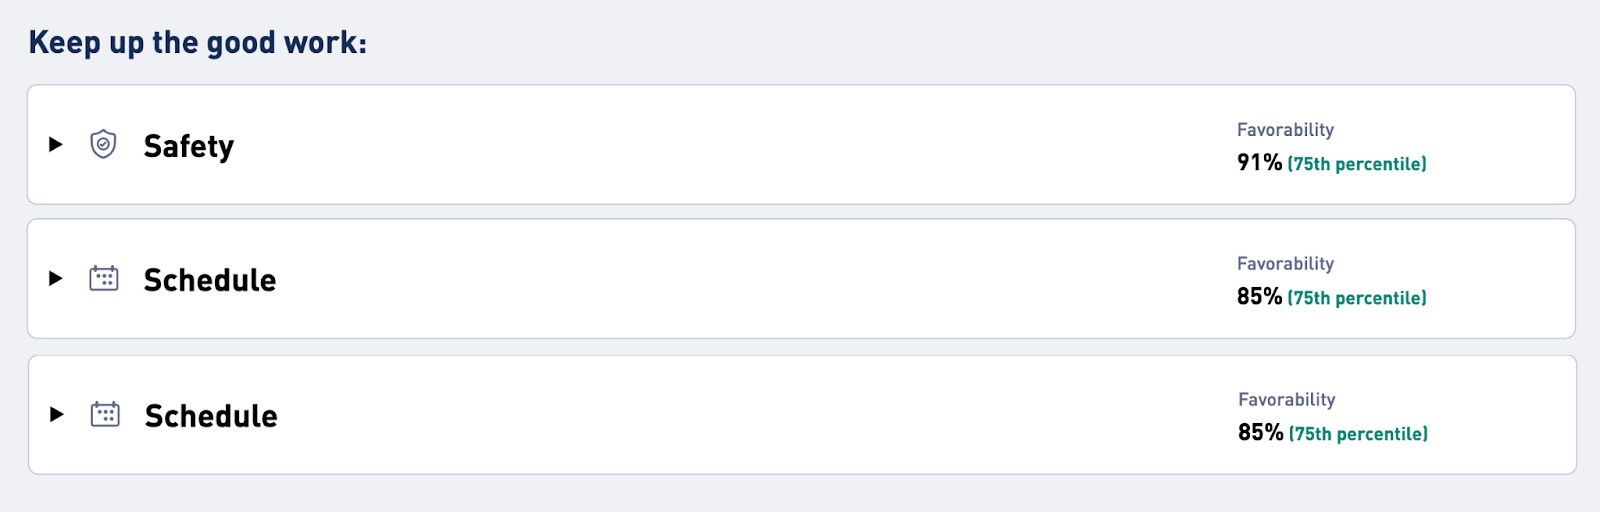
Keep up the good work
Areas where your favorability score is higher than the industry average. Favorability scores above the 66th percentile.
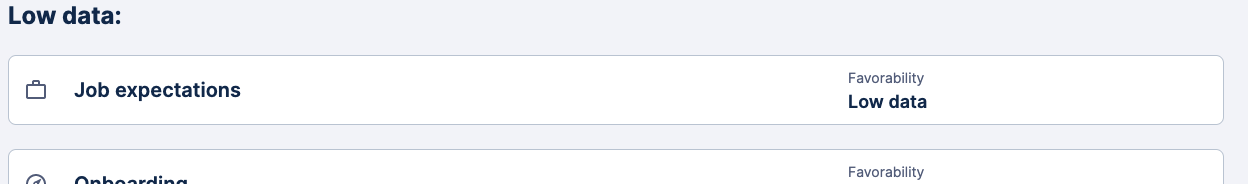
Low data
Areas where not enough data has been collected to calculate favorability
Filters
The Opportunities page only displays data for the facilities when both of these conditions are fulfilled:
- Data on the opportunities page is filtered based on what data the user has access to; if a user only has access to one or more facilities, the user will only see data associated with those specific facilities.
- Data on the Opportunities page can be furthered filter based on the available filters.
Theme details
Themes are created based on ratings by employees for related check-in questions.
You can expand any theme to view additional data and a breakdown of the score. Data is divided into two groups: feedback provided by favorable and unfavorable responders.
- Favorable responders answered 4 (Agree) or 5 (Strongly Agree) on a 5-point question scale.
- Unfavorable responders answered 1 (Strongly disagree), 2 (Disagree), or 3 (Neither agree nor disagree) on a 5-point question scale.
The information available per theme for each of these two groups is as described in the following table:
Component | Description |
Responses | The number of responses received for the currently displayed calculation for each of the favorable and unfavorable groups. |
Satisfaction | The average score of responses to questions related to this theme where answers are on a 1-5 scale. 1 corresponds to “Very dissatisfied” and 5 corresponds to “Very satisfied.” |
Turnover rate | The turnover rate for each of the favorable and unfavorable groups of responders. Turnover is calculated by taking the total number of terminations divided by the total number of employees who responded in the last 180 days for this theme, for employees who are at least 60 days from their start date. |
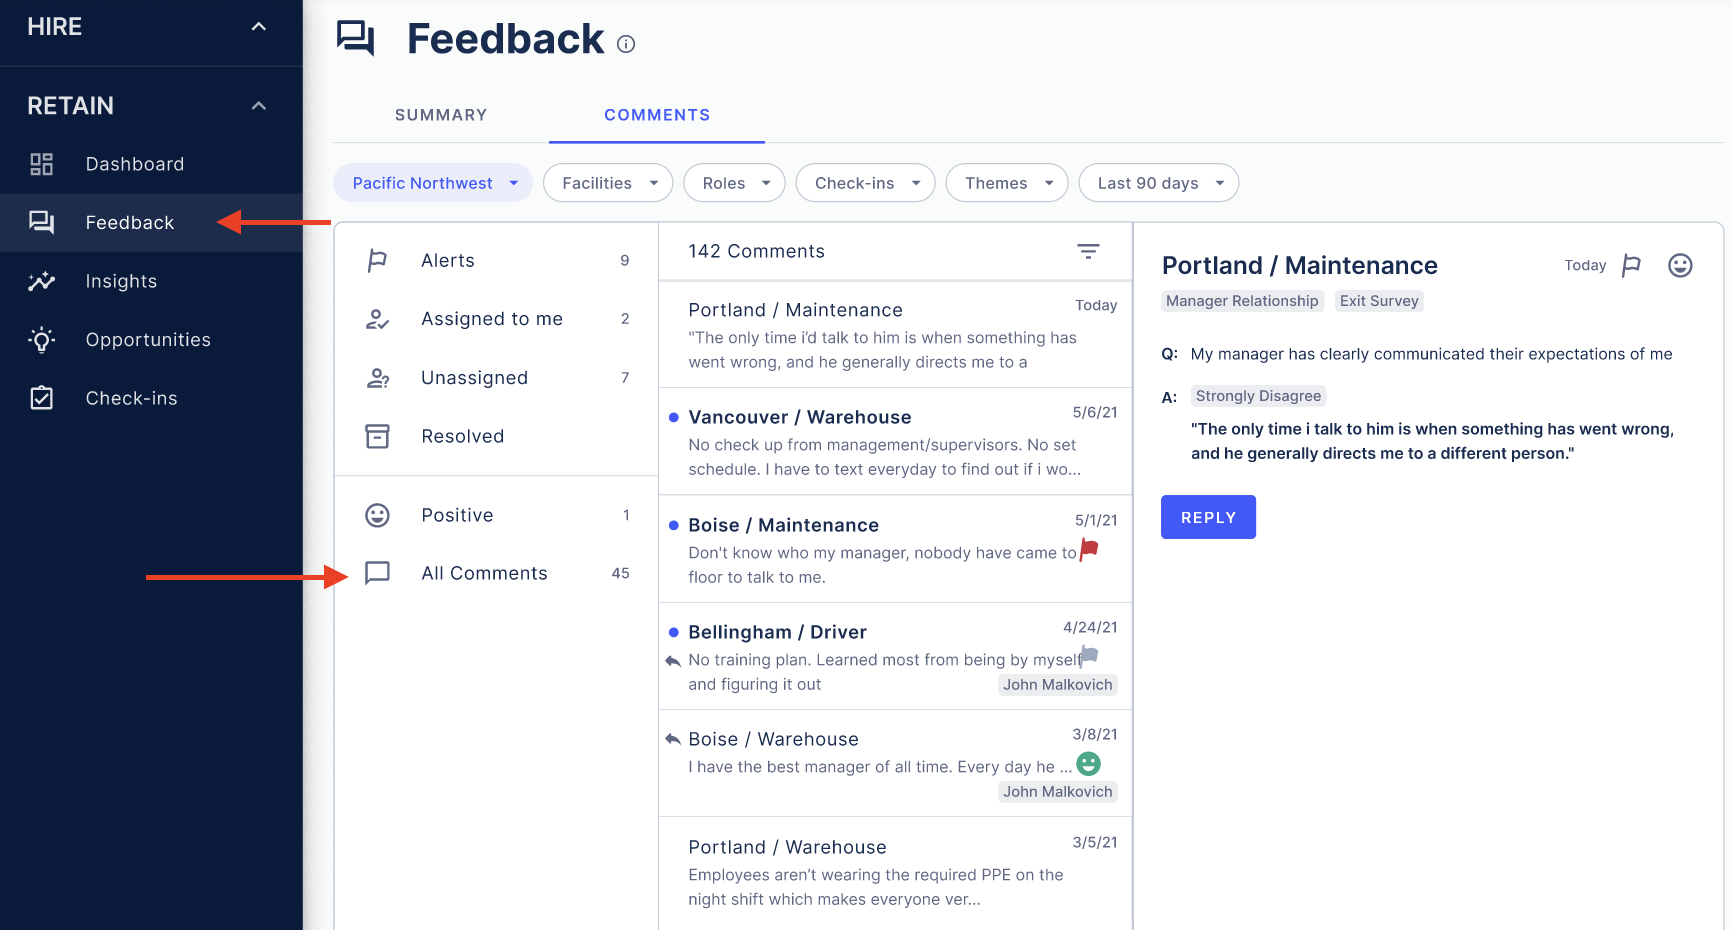
Recent Comments
This section includes the most recent comments left by employees for this theme. These are sorted in order of most recent and include a mix of favorable and unfavorable comments.
Top Three Opportunities
In addition to the data you can find in the Opportunities area, your top three opportunities for improvement (as described in Opportunities Overview) are displayed on the WorkStep RETAIN homepage. Top opportunities have the largest turnover reduction or have the lowest percentile score for favorability.

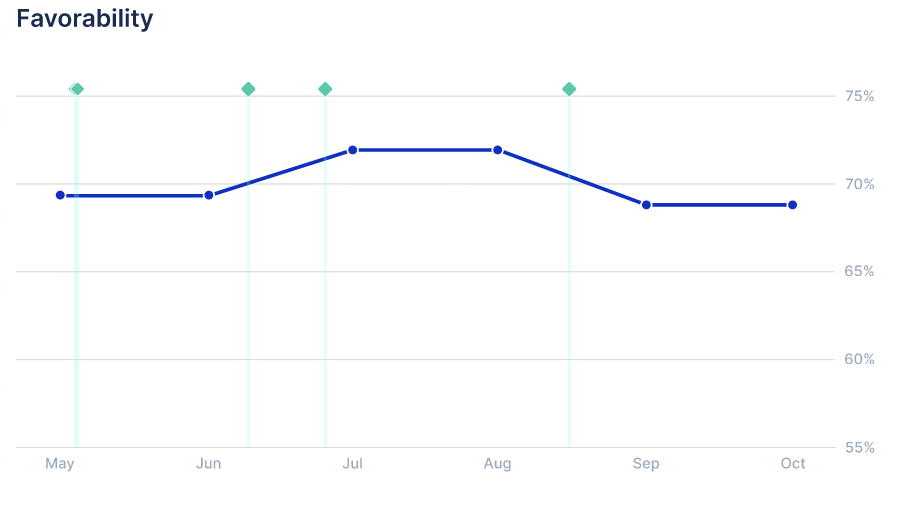
About Favorability Scoring
- Each theme is given a percent favorability score. Percent favorability is a more granular way to communicate average scores for questions in this theme than average satisfaction because it's on a scale of 1-100 which makes it easier to interpret and compare to other numbers.
- Percent favorability is the percentage of employees who answered favorably on a question. Favorable responders responded to the question with a 4-5 score.
- The percent favorable can be calculated with as few as 15 responses which provides quicker results on the opportunities page. If you don’t have 15 responses for a specific theme, that theme will be hidden on the page.
- The time period used to calculate favorability is a rolling 6-month period.
- We compare your favorability score against scores in the industry for each theme to provide the favorability percentile.
About Themes
Themes are created based on a group of related questions. Employees rate their experience during their regular check-ins on a scale of 1-5.
Below is a list of themes included by default in the WorkStep RETAIN and the associated questions:
Theme | Questions |
Benefits |
|
Career growth |
|
Feedback |
|
General Satisfaction |
|
Job expectations |
|
Manager expectations |
|
Manager relationship |
|
Onboarding |
|
Pay |
|
Physicality |
|
Safety |
|
Schedule |
|
Teamwork |
|
Tools |
|
Note: a custom theme cannot be compared against the industry average, and therefore will not have a favorability percentile score. If a custom theme does not have a “turnover reduction” above the mid-level threshold, then the theme is categorized under “Average.”
Open training sessions are available! Looking for some help getting started with WorkStep? In need of a refresher on best practices or feature functionality? Join us for one of our biweekly trainings by RSVPing here!